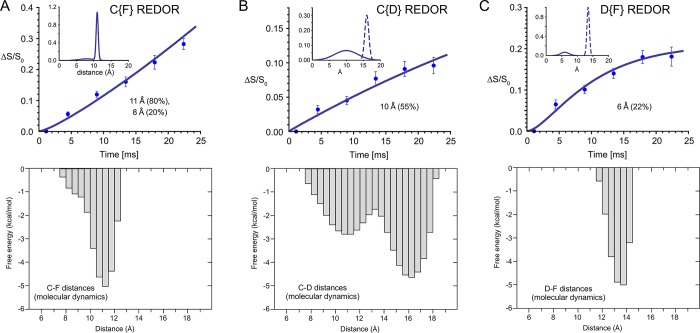
Figure 3.
Identification and quantification of distance distributions for PKCδ-C1b-bound bryolog 1 by REDOR NMR and molecular dynamics simulations. (A) C{F} REDOR, (B) C{D} REDOR, and (C) D{F} REDOR dephasing data with fits by distribution of distances (top panels) and corresponding distributions of the C–F, C–D, and D–F distances of bryolog 1 as a function of the free energy of the PKCδ-C1b–bryolog–phospholipid complex as calculated by molecular dynamics simulations.

