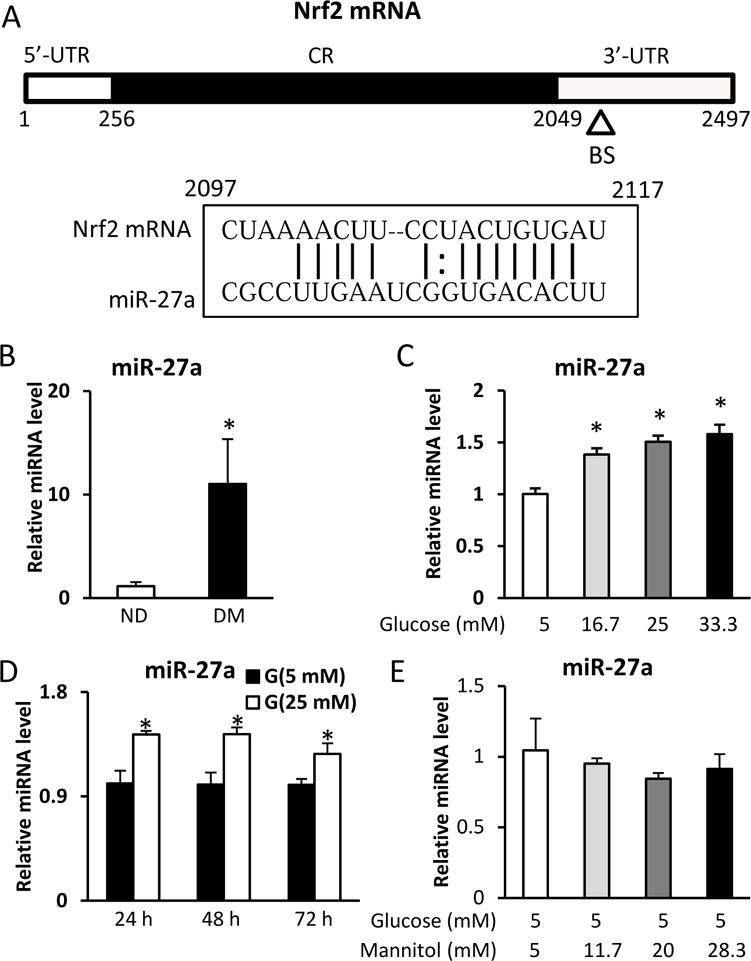
Figure 2. Maternal diabetes in vivo or high glucose in vitro decreases miR-27a expression.

A. Schematic representation of the Nrf2 mRNA depicting the binding site for miR-27a in its 3′-UTR. CR: coding region; BS: binding site; UTR: untranslated region. B. miR-27a levels in E8.5 embryos assessed by RT-qPCR. C. miR-27a levels in C17.2 cells treated with normal (5 mM) or high (16.7, 25, 33.3 mM) glucose for 48 h, assessed by RT-qPCR. D. miR-27a levels in C17.2 cells treated with normal (5 mM) or high (25 mM) glucose for 24 h, 48 h, and 72 h, assessed by RT-qPCR. E. miR-27a levels in C17.2 cells treated with normal glucose (5 mM) or high mannitol (11.7, 20, 28.3 mM) for 48 h, assessed by RT-qPCR. Experiments were repeated using 3 embryos (N =3) from different dams. Experiments were repeated three times. ND: nondiabetic dams; DM: diabetic dams. * indicates significant difference (P < 0.05) compared with other groups.
