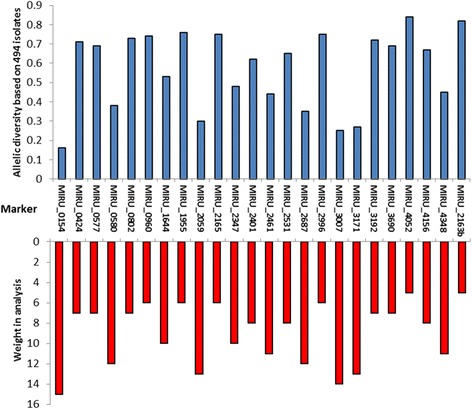
Fig. 1.

Conversion of allelic diversity of markers in MIRU-VNTR 24 loci kit into weight for the median vectors’ analysis. Top graphic (in blue) corresponds to the allelic diversity in each VNTR as calculated by Supply et al., 2006 [12] and the lower graphic (in red) corresponds to the linear conversion of this diversity into weights from 5 to 15 in the network software
