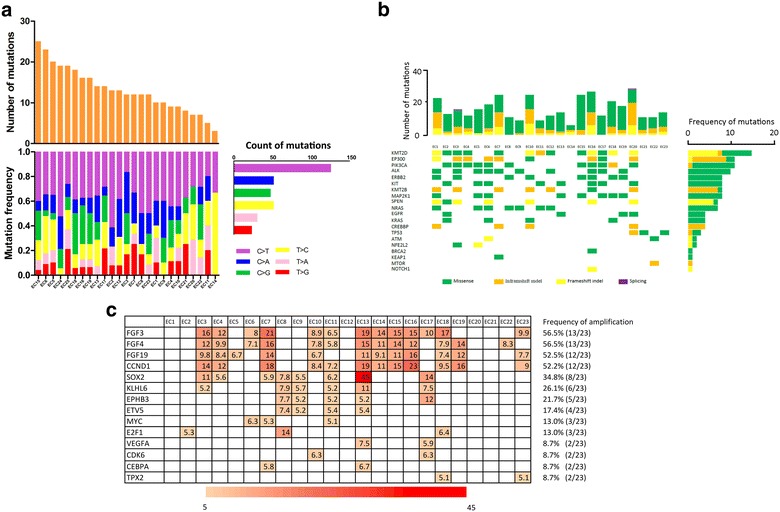
Fig. 3.

Genomic characterization identified in PDX models of ESCC. a Spectrum of somatic point mutations were analyzed and each bar represents one sample. Samples were ordered by the number of mutated genes (top). Six types of single nucleotide transversion were found (different colors; horizontal axis). The vertical axis depicts percent of mutations attributed to a specific mutation type (bottom). Total gene numbers for six classes of base substitutions in 23 PDX models (right). b Mutation frequencies and signatures in 23 PDXs of ESCC. Number of somatic mutations of each examined case (top). The ten most frequently mutated genes and ten important genes identified in the literatures, including total mutated samples per gene and mutation subtypes (If multiple mutations were observed within a gene in a single sample, only one was shown. Columns, examined cases; Rows, genes (bottom). Frequencies of somatic mutations for each gene shown on right. c Summary of copy number variation. Genomic identification of 14 genes amplified in two or more models. Genomic profile with copy number data (> 5) in heat map. Color bars are a gradient in accordance with number. Frequency of amplification on left
