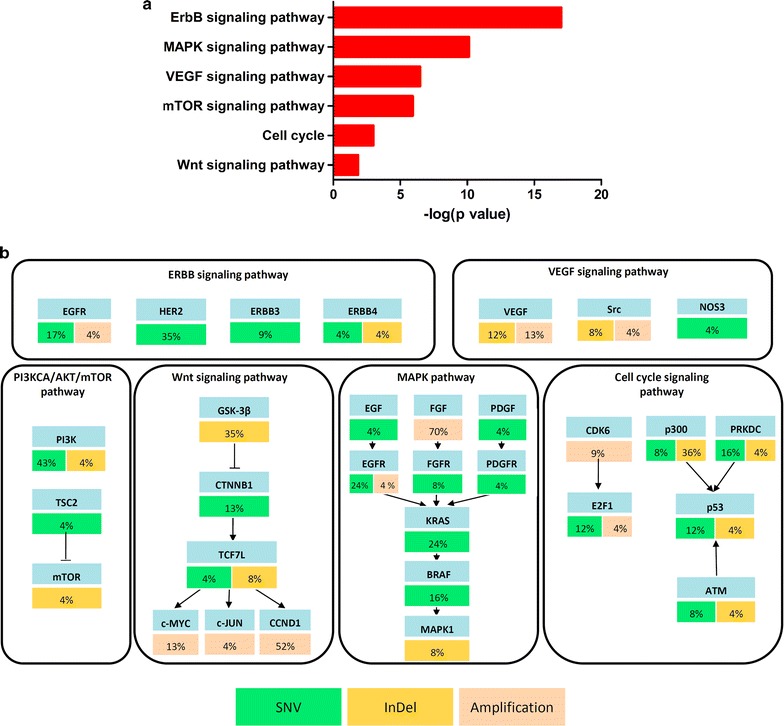
Fig. 4.

Dysregulated pathways in PDX models of ESCC. a Significantly altered pathways (p < 0.05) were enriched and presented. b ESCC potential driver genes, mutation frequencies mapped and alteration frequencies shown as percent of all samples; genes identified as SNV are green; InDel are yellow; and amplified genes are pink. Excitatory (arrows) and inhibitory (black lines) interactions were obtained from the KEGG pathway database
