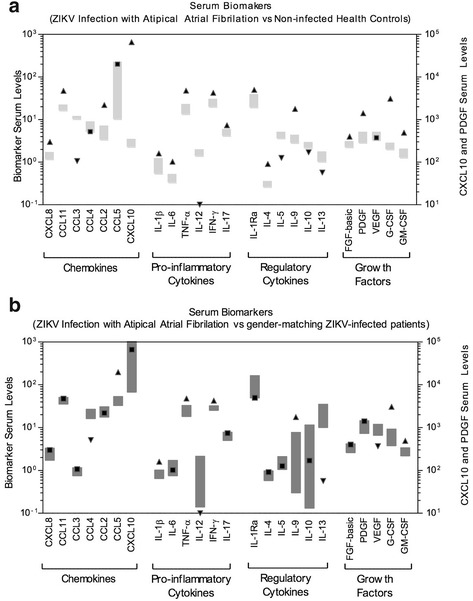
Fig. 1.

Overview of serum chemokines, cytokines and growth factors of the atrial fibrillation patient compared to control groups. Serum biomarkers: CXCL8 (IL-8); CXCL10 (IP-10); CCL11 (Eotaxin); CCL3 (MIP-1α); CCL4 (MIP-1β); CCL2 (MCP-1); CCL-5 (RANTES); IL1-β, IL-6, TNF-α, IL-12; IFN-γ, IL-17; IL-1Ra (IL-1 receptor antagonist); IL-2; IL-4; IL-5; IL-7; IL-9; IL-10; IL-13; IL-15; FGF-basic; PDGF; VEGF; G-CSF and GM-CSF were measured by high performance microbeads 27-plex assay, as described in materials and methods, with the 95%CI represented by gray boxes. Black arrows represent an increase (up) or decrease (down) in the patient’s biomarkers level in comparison to control groups; a black square represents biomarkers levels at the 95%CI. a Biomarkers’ levels: case vs. gender matching non-infected heath controls; (b) Biomarkers’ levels: case vs. gender matching ZIKV-infected patients
