
Fig. 6.
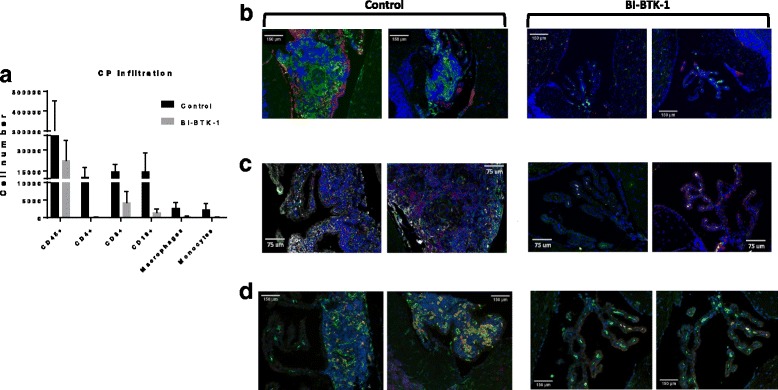
Characterization of the choroid plexus infiltrates. a Flow cytometric analysis of choroid plexus (CP) infiltrating immune cells in a small pilot study (BI-BTK-1, n = 2; control, n = 2) revealed infiltration of leukocytes, T cells, B cells, and macrophages. Immunofluorescent staining confirmed large populations of macrophages (green) accumulating in the choroid plexus of control mice (b), and increased IgG deposits (magenta) compared to BI-BTK-1-treated mice (c). Control mice also had increased numbers of T cells (red), B cells (green), and C3 complement deposition (gray). d Macrophages infiltrating the control-treated mice CPs had an activated phenotype (Mac-2+) compared to the BI-BTK-2-treated mice. Representative images are shown in all panels (BI-BTK-1, n = 7; control, n = 7)