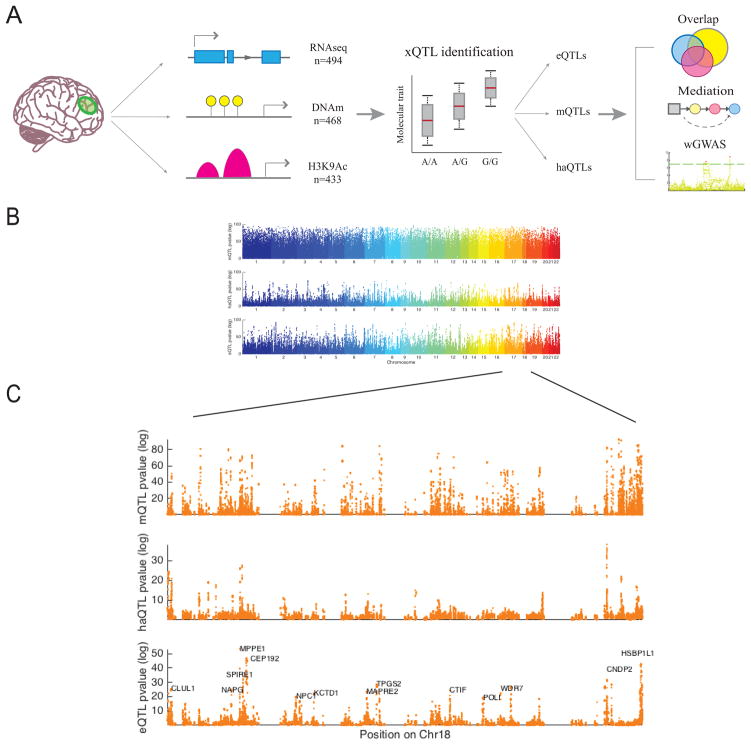
Figure 1. Overview of xQTL analysis.
(A) Graphical summary of our data and analyses. We first associate genetic variation with each data type separately to establish our xQTL reference. We then use these xQTLs to assess whether a given SNP influences more than one data type, whether epigenomic features mediate the effects of SNPs on gene expression, and whether our xQTLs can be leveraged to discover new susceptibility loci. (B) −log10 p-value of Spearman’s correlation between SNPs and DNA methylation (mQTL), histone acetylation (haQTL), and gene expression (eQTL) vs. the SNPs’ physical positions in the genome. Each dot represents the strongest association within a cis window for each SNP. (C) Zoomed in Manhattan plot of chromosome 18 to illustrate p-value distribution of xQTLs at a higher resolution.

