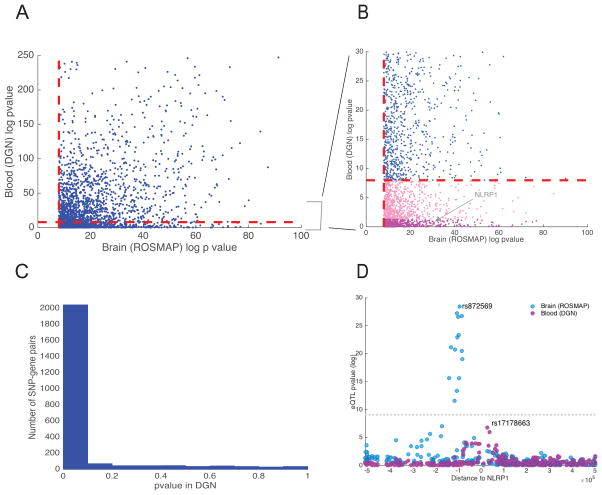
Figure 2. Cross-tissue replication analysis.
(A) Scatter plot of −log10 p-values of associations between the lead brain eQTL SNPs and their associated genes in brain and blood. The dashed red lines denote the significance threshold (αFWER=0.05 with Bonferroni correction). (B) −log10 p-value distribution of eQTLs that appear to be brain-specific (light and dark pink dots, the latter are specific to NLRP1). (C) Distribution of p-values from the DGN study restricted to brain eQTLs. Estimated replication rate (π1 statistics) between blood and brain eQTLs is 0.83. (D) eQTL p-values at NLRP1 locus. Each dot represents one SNP tested in either brain (ROSMAP) or blood (DGN). The x-axis corresponds to the distance between each assessed cis SNP and NLRP1’s TSS, and the y-axis corresponds to −log10 p-values for association between SNPs and NLRP1 expression. The LD between the lead SNP in blood and brain is r2 < 0.1.

