Figure 9.

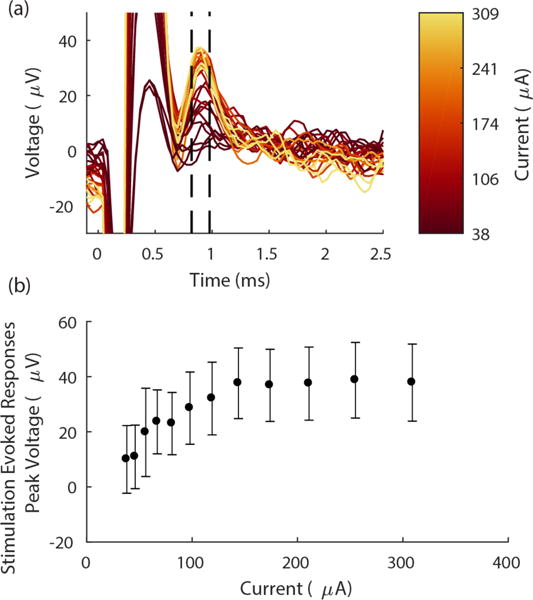
Stimulation with EIROF coated carbon fiber electrodes evokes robust, graded responses. (a) Carbon fiber array evoked response amplitudes increased with increasing stimulation intensity. Each trace shows the mean evoked voltage response in the nerve over n = 20 trials. Responses are aligned (at t = 0) to the onset of stimulation pulse (biphasic, 100 μs/phase); color indicates stimulation current. Dashed black lines denote window of response shown in (b). Stimulation artifact appears at 0 < t < 0.6 ms. (b) Mean peak amplitude of the evoked response over a range of stimulation intensities, measured between 0.8-1 ms after the stimulation onset. (Time window denoted by the dashed lines in (a)). Each data point shows n = 20 trials; error bars indicate standard deviation.
