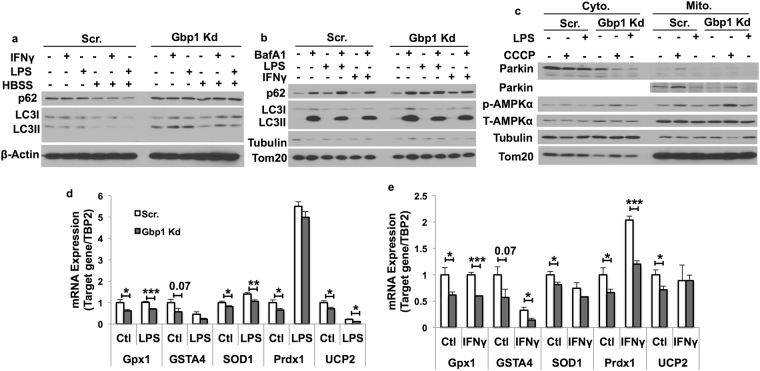
Figure 4.
Effect of Gbp1 downregulation on mitophagy in macrophages. (a) Autophagic proteins p62 and LC3I/II levels in macrophages treated with LPS (1 μg/ml) or IFNγ (10 ng/ml) for 1 hour under fed or starvation conditions. (b) Autophagic protein levels in mitochondrial fraction of macrophages treated with LPS (100 ng/ml) or IFNγ (10 ng/ml) in the presence or absence BafA1 (100 nM) for 4 hours. (c) The levels of mitophagy related proteins in cytosolic and mitochondrial fractions isolated from macrophages treated with 100 ng/ml LPS or 10 μM CCCP for 4 hours. (d,e) mRNA expression levels of genes encoding anti-oxidative enzymes in macrophages treated with either 100 ng/ml LPS (d) or 10 ng/ml IFNγ (e) for 24 hours. The results are mean ± SEM. *P < 0.05, **P < 0.01, ***P < 0.001 versus Scr cells. HBSS: Hanks’ Balanced Salt Solution; CCCP: Carbonyl cyanide m-chlorophenylhydrazone. Full-length of all blots are provided in Supplementary Fig. 8.

