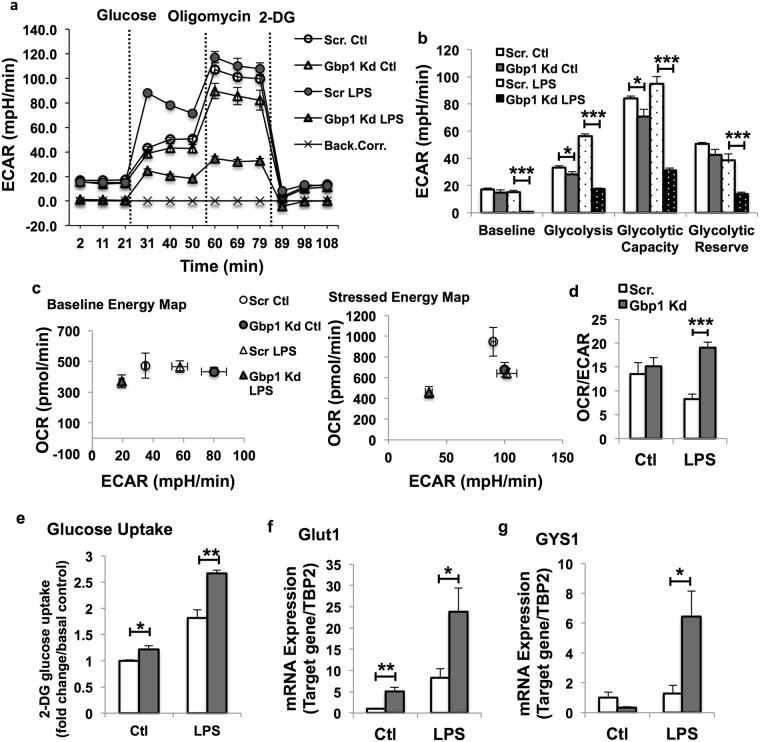
Figure 5.
Effect of Gbp1 downregulation on LPS-induced glycolysis in macrophages. (a–d) ECAR in Scr and Gbp1 Kd macrophages treated with LPS (100 ng/ml) for 4 hours (n = 5). Back.Corr.: Background Correction. (e) 2-Deoxy glucose uptake in Scr and Gbp1 Kd macrophages under basal and LPS-treated conditions. Three independent experiments were performed. Error bars represent standard error. (f,g) mRNA expression levels of genes involved in glucose uptake and glycogen synthesis in Scr and Gbp1 Kd macrophages. The data for gene expression are presented as mean ± SEM; the experiment was repeated 2–3 times. *P < 0.05, **P < 0.01, ***P < 0.001; versus Scr cells.

