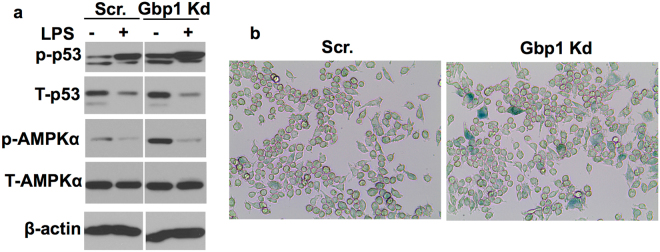
Figure 6.
Effect of Gbp1 downregulation on cellular senescence in macrophages. (a) Phosphorylated p53 and AMPK levels in Scr and Gbp1 Kd macrophages treated with 100 ng/ml LPS for 24 hours. Samples were run in the gels under the same experimental conditions while images of western blots displayed in cropped format. Full-length blots are provided in Supplementary Fig. 9. (b) Representative β-gal staining of Scr and Gbp1 Kd macrophages under the basal condition. The values of protein expression are mean ± SEM. *P < 0.05 versus young mice. The blots of p-p53, T-p53, p-AMPKα, T-AMPKα and β-actin for Scr. and Gbp1 Kd macrophages in panel B were cropped from different parts of a same gel. White space was used between all the blots for Scr. and Gbp1 Kd cells.

