Figure 5.

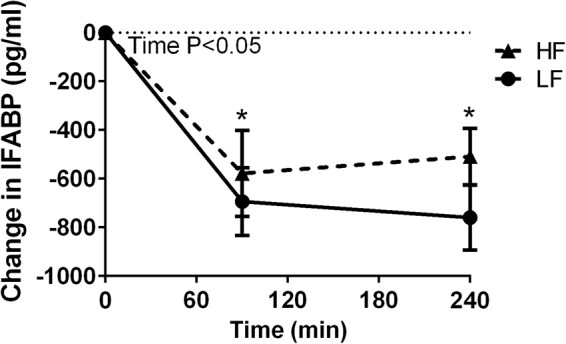
Change in intestinal fatty acid-binding protein (IFABP) after acute low-fat/high-carbohydrate (LF, black line, squares) and acute high-fat/low-carbohydrate (HF, dotted line, triangles) meal consumption. 1Values are mean ± SD. n = 8.

Change in intestinal fatty acid-binding protein (IFABP) after acute low-fat/high-carbohydrate (LF, black line, squares) and acute high-fat/low-carbohydrate (HF, dotted line, triangles) meal consumption. 1Values are mean ± SD. n = 8.