Abstract
While the amount of resource is an important factor in control of contagions, outbreaks may occur when they reach a finite fraction of the population. An unexplored issue is how much the resource amount is invested to control this outbreak. Here we analyze a mechanic model of epidemic spreading, which considers both resource factor and network layer. We find that there is a resource threshold, such that a significant fraction of the total population may be infected (i.e., an outbreak will occur) if the amount of resource is below this threshold, but the outbreak may be effectively eradicated if it is beyond the threshold. The threshold is dependent upon both the connection strength between the layers and their internal structure. We also find that the layer-layer connection strength can lead to the phase transition from the first-order phase to the continuous one or vice versa, whereas the internal connection can result in a different kind of phase transition (i.e., the so-called hybrid phase transition) apart from first-order and continuous one. Our results could have important implications for government decisions on public health resources devoted to epidemic disease control.
Introduction
Epidemic spreading is typically a dynamical process. In previous studies1–9, the spreading was considered to be in single or monoplex networks, which is apparently a simplification since in reality, epidemic diseases spread often through multiple channels, e.g., through different ways of human travelling (airports, train, bus, etc.), just as information may be diffused through different online social mediums such as Twitter and Facebook. Moreover, many epidemic spreading processes may simultaneously occur through multiple routes, e.g., sexually transmitted diseases may spread both in homosexual and in heterosexual networks. Compared to single networks, multilayer networks can explicitly consider the diversity of multi-channel connection and may well describe a system interconnected through different categories of connection, where each channel is represented by a layer network, which allows various possible kinds of connections between nodes and interactions between layer networks. Thus, advantages of the intrinsic characteristics of multilayer networks are in providing a natural way to extend and improve the understanding of spreading dynamics in real-world complex networked systems10–13.
Recently, Saumell-Mendiola et al. analyzed the effect of a multilayer coupled network on disease spreading using a classic susceptible-infected-susceptible (SIS) model14. They found that few inter-layer edges may cause a global endemic state in the entire network rather than in a single-layer network, and that the strength of degree-degree correlation between layers can decrease the epidemic threshold. By studying the susceptible-infected-recovery (SIR) epidemic spreading through a multilayer network, Dickison et al. revealed that in the case of strong coupling, an epidemic disease can spread from one layer to another at a critical infection strength below which the spread does not occur, while in the case of weak coupling, the epidemic spreads only within one layer when the critical infection strength is not reached15. Wei et al. proposed a model for cooperative spreading processes on interacting two-layer networks, and they proved that the epidemic threshold of the interaction is decreasing16. Velasquez-Rojas et al. investigated how opinion formation and disease spreading processes are mutually affected in multiplex networks17. Jovanovski et al. developed a SIS model of multiple contagions, which incorporates different spreading channels and disease mutations in a multilayer network18. Some authors considered other aspects of epidemic spreading in multilayer networks, including disease localization19, the effect of opinion exchanges on vaccination20, the interaction between the spreading of epidemics and awareness information21, and so on. In a short, the existing studies paid more attention on the impact of multilayer network structure or on the interaction between different epidemic dynamics.
In a realistic scenario, however, the available social and medical resources to treat diseases or to prevent their spreading are usually limited, and have been verified to be an important factor impacting disease spreading. This factor is directly relevant to the problem of designing optimal strategies for suppressing the epidemic outbreak to the greatest extent and for minimizing the prevalence once the epidemic outbreak has happened. Very recently, Shai et al. studied a model of a constrained SIR process on coupled networks where nodes are limited to interact with a maximum number of neighbors22. They found that in the absence of resource constraint, positive correlation coupling leads to a lower epidemic threshold than a negative one. In the presence of constraint, however, the spreading is less efficient in the former case than in the latter case. Similar results were found in ref.23, where Chen et al. assumed that the recovery rate is positively correlated with the average resource devoted to each infected individual and observed that the disease outbreak can be effectively eradicated, only when the amount of resource is above a critical value24. In addition, Chen25 and Enyioha26 presented a distributed resource allocation strategy to control an epidemic outbreak, respectively. Bottcher et al. considered that the recovery of sick individuals depends on the availability of healing resources that are generated by a healthy population, finding that epidemics spiral out of control into explosive spread if the cost of recovery is beyond a certain critical value27. In spite of these endeavors, how resource affects epidemic spreading in a multilayer network remains unexplored.
In the present paper, inspired mainly by the work of ref.24, we study the effect of resource amount on epidemic control using a modified SIS model. Specifically, this model considers a two-layer network consisting of two random networks A and B sharing the same set of nodes, as shown in Fig. 1, where the infected nodes in one subnetwork can pass the disease to their neighbors in another subnetwork until they finally recover. We assume that the recovery rate for infected individual is not a constant but a variable over time depending on the average resource that each infected node gets. By model analysis, we show that a critical resource amount is needed to suppress the disease spreading. In addition, we find interesting dynamical phenomena, e.g., given a resource amount, the spreading process goes through a first-order phase transition if the infection strength between layers is weak, but a continuous phase transition if the infection strength becomes strong, and the topological structure within a layer network can lead to a multi-phase behavior apart from first-order and continuous phase transitions.
Figure 1.
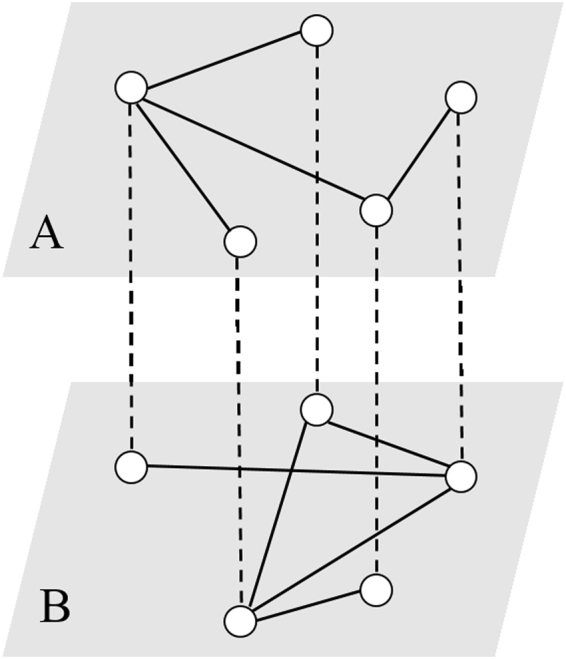
Schematic illustration of a two-layer network. The topologies in layers A and B may be different, but each node in one layer is connected to its counterpart in the other layer. Dashed and solid lines represent interlayer and intralayer connections, respectively.
Methods
As pointed out in the introduction, resource invested in curing an infected population plays a critical role in containing the epidemic spreading. In order to reveal the essential mechanism of how the resource affects control of epidemic diseases spreading through multiplex networks, we consider a two-layer network where each subnetwork is modelled by a discrete set of SIS equations. In both layer networks, each node may switch between the susceptible (S) state and the infected (I) state, and the links between the nodes represent the connections along which the disease can propagate. At each time step, the nodes with state S can be infected simultaneously by intra-layer and inter-layer infected nodes, but the infected nodes may recover to susceptible nodes.
Let β1 (β2) represent the transmission probability in network A (B) that an infected node spreads the disease to a neighbor to which it shares a link, γ1 (γ2) the probability of transmission from a node in B (A) to a node in A (B), i.e., each of γ1 and γ2 represents a connection strength between the two layers, and μ1(t) (μ2(t)) the recovery probability in network A (B) that an infected node recovers to a susceptible node at time step t. If γ1 = γ2 = 0, the disease spreads only in a single subnetwork. In this case, the model of epidemic spreading in the multiplex network is reduced to that in a single-layer network. If the only one of γ1 and γ2 is non-zero, then the disease spreading is unidirectional in the two-layer network. If both are non-zero, the spreading is bidirectional between the two layers. Denote by p1,i(t) and p2,i(t) the probabilities that a node i in networks A and B is at the infected state at time t, respectively. Then, the time evolutions of p1,i(t) and p2,i(t) can be described by the following discrete dynamical equations28,29:
| 1a |
| 1b |
where q1,i(t) and q2,i(t) are the probabilities that node i is not infected by any of its neighbors in A and B respectively, that is,
| 2a |
| 2b |
In Eq. (2), (aij) and (bij) represent the adjacency matrices of networks A and B respectively, and each of aij and bij takes value 1 when nodes i and j share a common link and value 0 otherwise. N is the size of network A or B.
In the first line of Eq. (1a), the first term on the right-hand side, 1 − p1,i(t), is the probability that node i is susceptible whereas 1 − q1,i(t) is the probability that node i is infected by at least a neighbor in layer A, the second term represents the probability that node i is infected at time t and does not recover, and the third term takes into account the probability that the susceptible node i is infected by the counterpart node in layer B. Similar interpretations hold for Eq. (1b). The final infected population sizes in A and B are defined as fractions of the total population respectively, that is,
| 3 |
It is particularly emphasized that two recovery probabilities μ1(t) and μ2(t) in Eq. (1), which were originally assumed as constants in the traditional SIS model, are currently assumed as two time-varying parameters and depend on the average resource R that each infected node would get. Since the resource that a country uses to epidemic control is limited, R should be related to the financial power of this country in practical control of epidemic diseases. Furthermore, we assume that R is a percentage of the fully economic output of a country, evaluated between 0 and 1. According to the experimental results of ref.24, we may assume that two recovery probability functions take the forms
| 4 |
where c is a control coefficient to decide the relative importance of ρi(t) and R, and we will set c = 1 for simplicity. Since each recovery probability for infected individuals, μi(t), decreases with the decrease of R, and is close to 0 when R → 0, this assumption is reasonable (remark: here we consider only the case that epidemic diseases are so severe or fatal that the infected people cannot be recovered without drug treatment, implying that the case that people can self-heal without medicine is not considered). Note that when R → 0, the present epidemic model is reduced to the traditional SI model.
In order to reveal the essential mechanism of how the average resource amount impacts epidemic control, we consider a special case in the following, that is, the two-layer network is assumed to consist of two random regular networks with uniform degree k1 and k2, respectively. In this case, Eq. (2) becomes
| 5a |
| 5a |
Since the nodes in a random regular network are indistinguishable from each other, it follows from Eq. (3) that pi,j(t) = ρi(t) (i = 1, 2, j ∈ 1, & …; N), which is equivalent to the mean field approximation. When the epidemic spreading process reaches steady state, and if we denote by ρ1 and ρ2 the final infected population sizes for A and B at steady state respectively, Eq. (1) will be reduced to
| 6a |
| 6b |
From Eq. (6), we can establish the following relationship between the final infected population sizes in two subnetworks
| 7 |
Furthermore, we can derive the following algebraic equation of from Eq. (6) combined with Eq. (7)
| 8 |
In the small limit of resource amount R, Eq. (8) is further reduced to the following algebraic equation of ρ1
| 9 |
which has a nontrivial solution under some conditions of system parameters, apart from the trivial solution ρ1 = 0. Note that a nontrivial ρ1 implies a nontrivial ρ2 according to Eq. (7).
In our numerical analysis, except that the effect of R is considered, the effect of the only one connection strength (i.e., γ1) is considered due to symmetry of our model. Therefore, it is unnecessary to additively consider the case of γ2.
Results
A critical resource amount for epidemic control
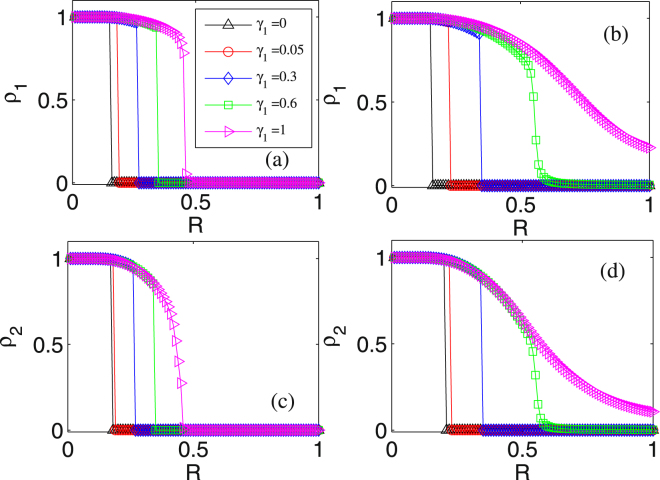
Here we investigate the influence of resource amount (R) on two final infected subpopulations quantified by ρ1 and ρ2. Numerical results are shown in Fig. 2, where the values of parameters k1, k2 and β1, β2 are fixed. Specifically, Fig. 2(a,b) shows the dependence of ρ1 on R for several different values of γ1 in two cases of γ2: a small connection strength, e.g., γ2 = 0.08 to which Fig. 2(a) corresponds, and a large connection strength, e.g., γ2 = 0.2 to which Fig. 2(b) corresponds. From these two panels, we observe that in both cases, ρ1 is a monotonically decreasing function of R but the change tendency is different. In the case of small γ2, the curves for the dependence of ρ1 on R always exhibit discontinuity whatever γ1. In contrast, in the case of large γ2, the curves for the dependence of ρ1 on R exhibit first discontinuity for small values of γ1 and then continuity for large values of γ1.
Figure 2.
Influence of resource amount on the fraction of the infected population: (a,b) dependence of ρ1 on R for different values of γ1, where (a) γ2 = 0.08 and (b) γ2 = 0.2 are fixed; (c,d) dependence of ρ2 on R for different values of γ1, where (c) γ2 = 0.08 and (b) γ2 = 0.2 are fixed. The other parameter values are set as ρ1(0) = ρ2(0) = 0.1, k1 = k2 = 30, and β1 = β2 = 0.02.
It is interesting that in the case of small γ2, e.g., γ2 = 0.08 for Fig. 2(a), there is a critical value of R, denoted by Rc, such that at this critical threshold, ρ1 has a sudden transition from non-zero value to zero, which is a signature of the first-order phase transition. Specifically, if R < Rc, then the disease will spread to a large fraction of the population in network A, whereas if R < Rc, then it will be well contained within a negligible fraction of the population. Moreover, the critical threshold Rc is dependent on the connection strength between layers, γ1. Precisely, the larger γ1 the larger Rc. However, a larger γ1 means that the disease is more easily transmitted from layer B to layer A, indicating that it is needed to invest the more resource to contain the disease spreading in layer A. From panel (b) which corresponds to a large γ2, we observe that ρ1 undergoes a significant change from the first-order phase transition to continuous phase transition, i.e., ρ1 decreases continuously from non-zero to a finite value with the increase of R. A possible reason for this change is that the more average resource amount is needed to suppress epidemic spreading since increasing γ1 or γ2 means that the disease spreads more easily from layers A to B or vice versa. When γ1 is small, the disease is effectively controlled since the system behaves as the first-order phase transition with a large Rc, but when γ1 is large, a small fraction of population is still infected as no more resource amount is supplied.
In panels (c) and (d), ρ2 has the change tendency similar to ρ1. However, the values of ρ2 and ρ1 are dependent on γ2 and γ1 when the other parameters are kept the same. If γ2 > γ1, which means that the disease is more easily transmitted from layers A to B than from layers B to A, then ρ2 > ρ1 with the same R. Otherwise, ρ2 < ρ1 with the same R. For example, for the case of γ1 = 1.0 shown by the pink symbols in the figure, it is apparent that the value of ρ2 in panel (c) is smaller than that of ρ1 in panel (a) with the same resource amount.
In a word, from the viewpoint of dynamics, parameter R can induce first-order and continuous phase transitions of ρ1 and ρ2, depending on γ1 and γ2, implying that investing a suitable amount of resource can well control epidemic spreading, which is a main result of this paper.
Influences of layer-layer connection strengths on infected populations at fixed amounts of resource
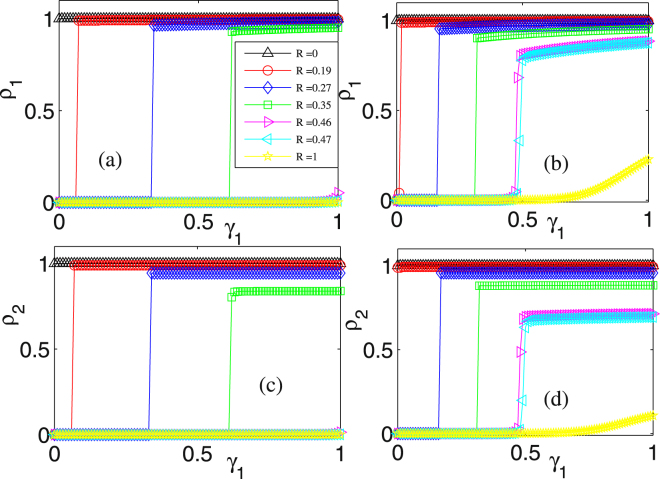
The influence of layer-layer connection strength on the fraction of the infected population for different resource amounts is shown in Fig. 3. Panel (a) corresponds to γ2 = 0.08. If R = 0, then the recovery rate for each individual is zero, implying that the final infected population ρ1 is equal to one. If R > 0, ρ1 increases discontinuously with the increase of γ1. For a given R and at the critical threshold γ1c,ρ1 jumps abruptly from zero to a non-zero value, behaving as the first-order phase transition. If the resource amount is large enough, e.g., up to Rc = 0.47 represented by the cyan symbols in panel (a), ρ1 is close to zero, implying that no disease spreads regardless of γ1. In panel (b) where γ2 = 0.2 that means that the connection strength between layers has been enhanced in contrast to panel (a), ρ1 increases from zero to a finite value at smaller γ1c compared to the case of panel (a). In addition, even though R > Rc = 0.47, ρ1 is no longer zero but goes through a continuous phase transition and grows to a finite value as γ2 continuously increases. Panels (c) and (d) show similar influence of γ1 on ρ1 as in panels (a) and (b). When γ1 is larger than γ2 = 0.08 (panel (c)) or γ2 = 0.2 (panel (d)), the value of ρ2 is smaller than that of ρ1, or vice versa. The reason for this change is the same as in the cases of panels (c) and (d) in Fig. 2
Figure 3.
Influence of layer-layer connection strength on the fraction of the infected population for different resource amounts: (a,b) ρ1 vs γ1, where (a) γ2 = 0.08 and (b) γ2 = 0.2 are fixed; (c,d) ρ2 vs γ1, where (c) γ2 = 0.08 and (d) γ2 = 0.2 are fixed. The other parameter values are set as ρ1(0) = ρ2(0) = 0.1, k1 = k2 = 30, and β1 = β2 = 0.02.
In a word, for a given resource amount, parameter γ1 or γ2 can induce first-order phase transitions of ρ1 and ρ2, implying the importance of the connection strengths between layers in controlling the spreading of epidemic diseases, in accordance with the common sense.
The joint influences of resource amount and layer-layer connection strengths on infected populations
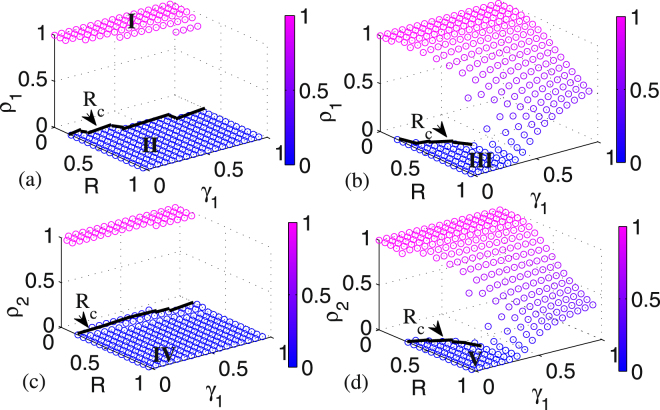
Figure 4 shows the joint influence of resource amount R and layer-layer connection strength γ1 on the final infected population ρ1. In panel Fig. 4(a) where γ2 = 0.01 is fixed, it is obvious that when the resource amount is inadequate, e.g., it is less than the critical threshold Rc indicated by black line, ρ1 is in a region of the active state30,31 where the disease could spread out in a high fraction of population, as shown in region I marked by pink color in panel Fig. 4(a). Once R > Rc, ρ1 will directly jump to a region of the absorbing state30,31 where the disease could be die out eventually, as shown in region II marked by blue color. The epidemic spreading process is characterized by the first-order phase transition, which does not change with γ1. In panel Fig. 4(b) where γ2 is set as 0.4, we find that when γ1 < 0.3, the spreading process exhibits the behavior of a first-order phase transition, but when γ1 > 0.3, the pattern of spreading is changed to a continuous phase transition. Moreover, for a given resource amount R, a larger γ1 corresponds to a higher final infected population. These results are obtained by increasing γ2 that means that the disease spreads more easily from layer B to layer A.
Figure 4.
The joint influence of resource amount and layer-layer connection strength on the fraction of the infected population: (a,b) dependence of ρ1 on both R and γ1, where (a) γ2 = 0.01 and (b) γ2 = 0.4 are fixed; (c,d) dependence of ρ2 on both R and γ1, where (c) γ2 = 0.01 and (d) γ2 = 0.4 are fixed. In (a–d), the boundary for the critical threshold of Rc is indicated. The other parameter values are set as ρ1(0) = ρ2(0) = 0.1, k1 = k2 = 30, and β1 = β2 = 0.02.
In panels Fig. 4(c) and (d), ρ2 has a similar change tendency like ρ1. With a small γ2 in panel (c), ρ2 behaves as the first-order phase transition. However, with a large γ2 in panel (d), the pattern of ρ2 changes from the first-order phase transition to the continuous phase transition when γ1 is larger than 0.3. Furthermore, in panel (c), as γ2 is less than the main available range of γ1, the region with absorbing state in layer B (region IV shown in panel (c)) is larger than that in layer A (region II shown in panel (a)). Similarly, in panel (d), if γ1 < γ2 = 0.4, then the region with absorbing state in layer B (region V shown in panel (d)) is smaller than that in layer A (region III shown in panel (b)). However, if γ1 > γ2 = 0.4, then the final infected population size in layer B is smaller than that of layer A.
The above findings show that both the resource amount and the layer-layer connection strength can dramatically impact the behavior of the epidemic spreading process, that is, constraining the resource amount may result in the first-order phase of epidemic spreading, and the layer-layer connection strength may change the pattern of phase transition. As shown in Fig. 5, for the same value of γ2, as γ1 increases, the spreading process in layer A evolves from the first-order phase transition to the continuous phase transition. In particular, when γ1 or γ2 is small, only the first-order phase transition takes place.
Figure 5.
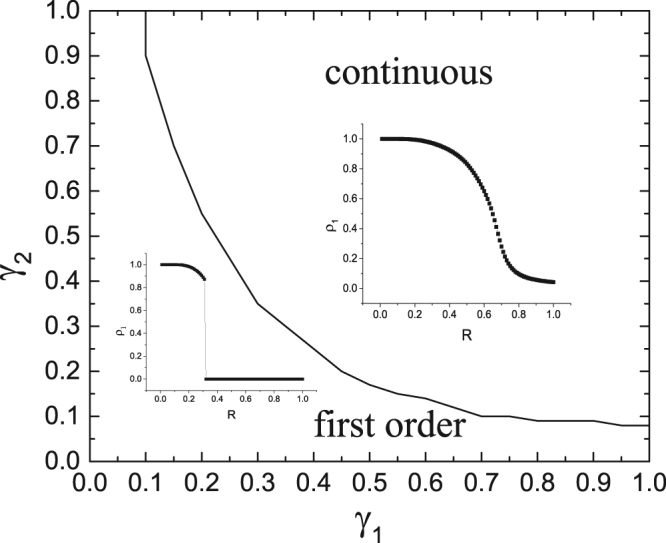
Phase regions of the system in the (γ1, γ2) plane, where a different sub-region corresponds to one different mode of the relationship between ρ1 and R. The other parameter values are set the same as Fig. 4.
The joint influences of resource amounts and subnetworks’ topological degrees on infected populations
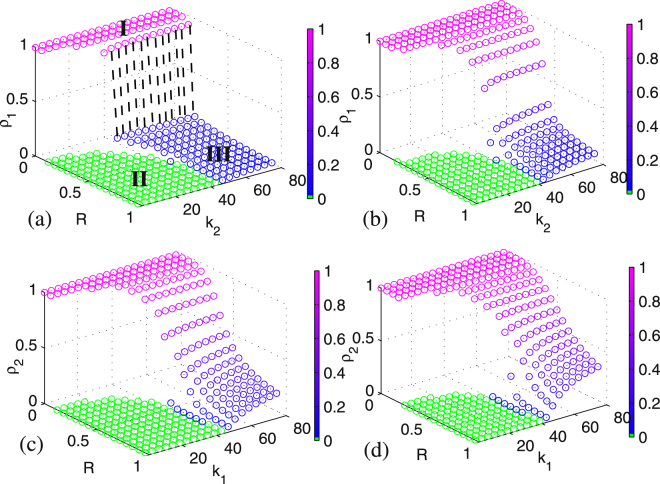
This subsection analyzes the impact of the connection strength within a layer network on the disease spreading. Note that a larger topological degree means a stronger connection strength within the layer network, which facilitates epidemic spreading in the full system. Figure 6 shows the joint influence of resource amount R and topological degree on the fraction of the infected population. In panel (a) where k1 = 4 is fixed, ρ1 may exhibit a first-order phase transition if k2 is less than 30. That is, ρ1 jumps abruptly from region I to region II marked by green color, meaning that the disease can be well controlled in a negligible fraction of population. Along with the increase of k2, the spreading process evolves from a first-order phase transition to another (i.e., the so-called hybrid phase transition), where ρ1 jumps sharply from region I to region III marked by blue color, meaning that the disease can be effectively controlled in a very low fraction of population.
Figure 6.
The joint influence of resource amount and topological degree on the fraction of the infected population: (a,b) dependence of ρ1 on both R and k2, where (a) k1 = 4 and (b) k1 = 30 are fixed; (c,d) dependence of ρ2 on both R and k1, where (c) k2 = 4 and (d) k2 = 30 are fixed. In (a), three different regions corresponding to three different kinds of phases are indicated. The other parameter values are set as ρ1(0) = ρ2(0) = 0.1, β1 = β2 = 0.02, and γ1 = 0.08, γ2 = 0.4.
In panel Fig. 6(b) where k1 is set as 30, an enlarged connection strength changes the pattern of the spreading process in layer A, which evolves from a hybrid phase transition to a continuous phase transition in the range of k2 > 40. In the range of k2 < 40, however, the spreading process still undergoes the first-order phase transition. In panel (c) where k2 = 4 is fixed, behavior of ρ2 is similar to that of ρ1 in panel (b) rather than in panel (a). A possible reason for this change is that γ2 is set much larger than γ1 in our simulation, resulting in a continuous phase transition of ρ2, not a hybrid phase transition at a large k1. When k2 increases to 30 in panel (d), ρ2 has similar spreading dynamics as in panel (c), but an enlarged connection strength can make both the values of critical threshold Rc at a small k1 and the final infected population at a large k1 become larger. The multi-phase behavior of the spreading process hints that there is a strong influence in spreading dynamics between two layer networks.
In order to more clearly show the multi-phase behavior of epidemic spreading in Fig. 6, we plot the phase regimes of the system for different internal connection strength k1 and k2 in Fig. 7. We observe that there is an abrupt switch between the hybrid phase transition and the first-order phase transition at the critical threshold Rc. The final infected population is a positive value in the former, but zero in the latter. Notice that at a small k1, three kinds of phase transitions could coexist, but for a large k1, only the continuous phase transition exists.
Figure 7.
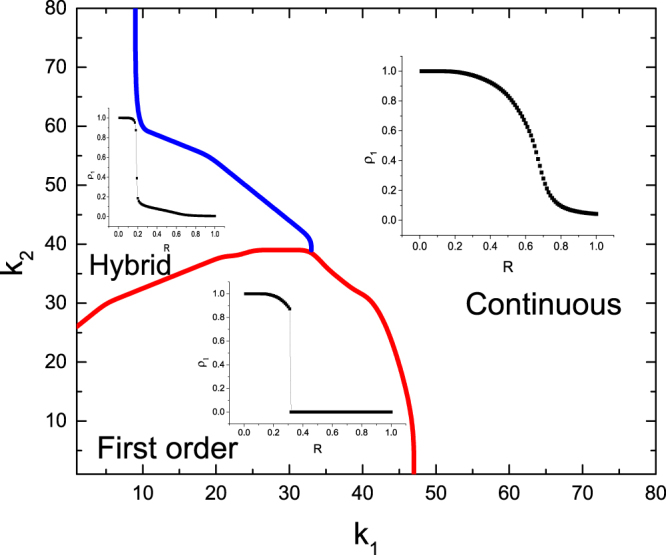
Phase regions in the (k1, k2) plane, where a different sub-region corresponds to a different mode of the relationship between ρ1 and R. The other parameter values are set as in Fig. 6.
Conclusions and simple Discussions
In contrast to previous studies that considered only single layer networks and did not consider resource factor, the present work considered not only resource amount invested to epidemic control but also a two-layer network consisting of two random networks sharing the same set of nodes. By analyzing a toy model (see Eq. (1)), we have found interesting dynamical phenomena, e.g., resource amount parameter R can induce not only first-order phase transitions but also continuous phase transitions of the fractions of the infected populations ρ1 and ρ2, depending on the connection strengths γ1 and γ2; parameter γ1 or γ2 can only induce first-order phase transitions of ρ1 and ρ2 for a given R; the cooperation between R and γ1 or γ2 can induce both first-order and continuous phase transitions of ρ1 and ρ2; and the cooperation between R and k1 or k2 can induce three different kinds of phase transitions of ρ1 and ρ2: first-order, continuous and hybrid. In particular, we have found that there is a critical value of resource amount (Rc) such that when R < Rc, the disease can spread to a large fraction of the population in subnetwork A, whereas when R > Rc, the epidemic spreading can be well contained in a negligible fraction of the population. These results not only indicate that resource investment is a pivotal factor of controlling epidemic spreading but also could have important implications for government decisions on public health resources devoted to epidemic control.
Although all the results obtained in this paper are qualitative, independent of the choice of model parameters, our model used for analysis made simplification in many aspects. For example, in a more realistic case, diseases would spread through more than two layer networks whereas our model considered only a two-layer network; a different subnetwork would have the different number of nodes but our model assumed that the number of nodes in both subnetworks is the same; and each node in a different subnetwork would have a different topological degree while our model assumed that it is the same. In spite of these, we are expecting that the results obtained here are kept qualitatively unchanged.
In addition, our model neglected the effect of noise. As is well known, the noise exists extensively in systems of epidemic disease spreading (in fact, the noise is inevitable during the process of epidemic spreading, due to the uncertainty of either spreading factors or environments). It is also well known that the noise can induce stochastic switching between different states of a dynamical system32–34. A naturally arising question is how the noise affects epidemic spreading in the case that the factor of resource investment is considered. It seems to us that none investigates such a question although it is worth study.
Finally, we point out that while resource and network layer are two unneglectable factors, the framework of modeling and analysis here would provide a paradigm for studying other similar real complex networks.
Acknowledgements
This work was partially supported by the National Natural Science Foundation of China under Grant Nos.11405118 (J.J.) and 91530320(T.Z.) and 973 project of Science and Technology department of China under Grant No. 2014CB964703 (T.Z.), as well as the projects of Education department of Hubei Province under Grant Nos. 16D049 and B2016066 (J.J.).
Author Contributions
J.J. and T.Z. conceived the study. J.J. performed numerical simulation. J.J. and T.Z. wrote the manuscript. All authors reviewed the manuscript.
Competing Interests
The authors declare that they have no competing interests.
Footnotes
Publisher's note: Springer Nature remains neutral with regard to jurisdictional claims in published maps and institutional affiliations.
References
- 1.Liu QH, Wang W, Tang M. The review of spreading dynamics on multilayer coupled networks. Complex Systems and Complexity. Science. 2016;13(1):48–57. [Google Scholar]
- 2.Wang LN, Sun MF, Chen SS, Fu XC. Epidemic spreading on one-way-coupled networks. Physica A. 2016;457:280–288. doi: 10.1016/j.physa.2016.03.111. [DOI] [Google Scholar]
- 3.Min B, Gwak SH, Lee N, Goh KI. Layer-switching cost and optimality in information spreading on multiplex networks. Scientific Reports. 2016;6(1):21392. doi: 10.1038/srep21392. [DOI] [PMC free article] [PubMed] [Google Scholar]
- 4.Vida R, Galeano J, Cuenda S. Vulnerability of state-interdependent networks under malware spreading. Physica A. 2015;421:134–140. doi: 10.1016/j.physa.2014.11.029. [DOI] [Google Scholar]
- 5.Wang Z, Andrews MA, Wu ZX, Wang L, Bauch CT. Coupled disease-behavior dynamics on complex networks: a review. Physics of Life Reviews. 2015;15:1–29. doi: 10.1016/j.plrev.2015.07.006. [DOI] [PMC free article] [PubMed] [Google Scholar]
- 6.Salehi M, et al. Spreading Processes in Multilayer Networks. IEEE Transactions on Network Science and Engineering. 2015;2(2):65–83. doi: 10.1109/TNSE.2015.2425961. [DOI] [Google Scholar]
- 7.Guo QT, et al. Two-stage effects of awareness cascade on epidemic spreading in multiplex networks. Phys. Rev. E. 2015;91:012822. doi: 10.1103/PhysRevE.91.012822. [DOI] [PubMed] [Google Scholar]
- 8.Granell C, Gomez S, Arenas A. Competing spreading processes on multiplex networks: Awareness and epidemics. Phys. Rev. E. 2014;90:012808. doi: 10.1103/PhysRevE.90.012808. [DOI] [PubMed] [Google Scholar]
- 9.Granell C, Gomez S, Arenas A. Dynamical Interplay between Awareness and Epidemic Spreading in Multiplex Networks. Phys. Rev. Lett. 2013;111:128701. doi: 10.1103/PhysRevLett.111.128701. [DOI] [PubMed] [Google Scholar]
- 10.Kivela M, et al. Multilayer Networks. Journal of Complex Networks. 2014;2(3):203–271. doi: 10.1093/comnet/cnu016. [DOI] [Google Scholar]
- 11.Boccaletti S, et al. The structure and dynamics of multilayer networks. Physics Reports. 2014;544(1):1–122. doi: 10.1016/j.physrep.2014.07.001. [DOI] [PMC free article] [PubMed] [Google Scholar]
- 12.Battiston F, Nicosia V, Latora V. The new challenges of multiplex networks: Measures and models. The European Physical Journal Special Topics. 2017;226(3):401–416. doi: 10.1140/epjst/e2016-60274-8. [DOI] [Google Scholar]
- 13.Domenico MD, Granell C, Porter MA, Arenas A. The physics of spreading processes in multilayer networks. Nature Physics. 2016;12:901–906. doi: 10.1038/nphys3865. [DOI] [Google Scholar]
- 14.Mendiola AS, Serrano M, Bogun M. Epidemic spreading on interconnected networks. Phys. Rev. E. 2012;86:026106. doi: 10.1103/PhysRevE.86.026106. [DOI] [PubMed] [Google Scholar]
- 15.Dickison M, Havlin S, Stanley HE. Epidemics on interconnected networks. Phys. Rev. E. 2012;85:066109. doi: 10.1103/PhysRevE.85.066109. [DOI] [PubMed] [Google Scholar]
- 16.Wei X, Chen SH, Wu XQ, Ning D, Lu JA. Cooperative spreading processes in multilayer networks. Chaos. 2016;26:065311. doi: 10.1063/1.4952964. [DOI] [PMC free article] [PubMed] [Google Scholar]
- 17.Velasquez RF, Vazquez F. Interacting opinion and disease dynamics in multiplex networks: Discontinuous phase transition and nonmonotonic consensus times. Phys. Rev. E. 2017;95:052315. doi: 10.1103/PhysRevE.95.052315. [DOI] [PMC free article] [PubMed] [Google Scholar]
- 18.Jovanovski P, Tomovski I, Kocarev L. Modeling the Spread of Multiple Contagions on Multilayer Networks. arXiv. 2017;1703:02906v1. [Google Scholar]
- 19.Arruda GF, de., Cozzo E, Peixoto TP, Rodrigues FA, Moreno Y. Disease localization in multilayer networks. Phys. Rev. X. 2017;7(1):011014. [Google Scholar]
- 20.Alvarez ZLG, Rocca CEL, Iglesias JR, Braunstein LA. Epidemic spreading in multiplex networks influenced by opinion exchanges on vaccination. arXiv. 2017;1705:08428v2. doi: 10.1371/journal.pone.0186492. [DOI] [PMC free article] [PubMed] [Google Scholar]
- 21.Guo QT, et al. Epidemic spreading with activity-driven awareness diffusion on multiplex network. Chaos. 2016;26:043110. doi: 10.1063/1.4947420. [DOI] [PMC free article] [PubMed] [Google Scholar]
- 22.Shai S, Dobson S. Effect of resource constraints on intersimilar coupled networks. Phys. Rev. E. 2012;86:066120. doi: 10.1103/PhysRevE.86.066120. [DOI] [PubMed] [Google Scholar]
- 23.Lee KM, Kim JY, Cho WK, Goh KI, Kim IM. Correlated multiplexity and connectivity of multiplex random networks. New Journal of Physics. 2012;14:033027. doi: 10.1088/1367-2630/14/3/033027. [DOI] [Google Scholar]
- 24.Chen XL, et al. Critical Amount of Resource in Containing Catastrophic Epidemics. arXiv. 2016;1611:00212v1. [Google Scholar]
- 25.Chen HS, Li GF, Zhang HF, Hou ZH. Optimal allocation of resources for suppressing epidemic spreading on networks. Phys. Rev. E. 2017;96:012321. doi: 10.1103/PhysRevE.96.012321. [DOI] [PubMed] [Google Scholar]
- 26.Enyioha, C., Jadbabaie, A., Preciado, V. & Pappas, G. Distributed resource allocation for control of spreading processes. 2015 European Control Conference (ECC), 2216–2221 (2015).
- 27.Bottcher L, Meza OW, Araujo NAM, Herrmann HJ, Helbing D. Disease-induced resource constraints can trigger explosive epidemics. Scientific Reports. 2015;5:16571. doi: 10.1038/srep16571. [DOI] [PMC free article] [PubMed] [Google Scholar]
- 28.Gomez S, Arenas A, Holthoefer JB, Meloni S, Moreno Y. Discrete-time Markov chain approach to contact-based disease spreading in complex networks. Europhys. Lett. 2010;89:38009. doi: 10.1209/0295-5075/89/38009. [DOI] [Google Scholar]
- 29.Cozzo E, Banos RA, Meloni S, Moreno Y. Contact based social contagion in multiplex networks. Phys. Rev. E. 2013;88:050801. doi: 10.1103/PhysRevE.88.050801. [DOI] [PubMed] [Google Scholar]
- 30.Marro, J. & Dickman, R. Nonequilibrium Phase Transitions in Lattice Models. (Cambridge University Press, England, 1999).
- 31.Henkel, M., Hinrichsen, H. & Lubeck, S. Nonequilibrium phase transition: Absorbing Phase Transition. (Springer-Verlag, Netherlands, 2008).
- 32.Wang J, Zhang J, Yuan Z, Zhou T. Noise-induced switches in network system of the genetic toggle switch. BMC Syst. Biol. 2007;1:50. doi: 10.1186/1752-0509-1-50. [DOI] [PMC free article] [PubMed] [Google Scholar]
- 33.Hasty J, Isaacs F, Dolnik M, McMillen D, Collins JJ. Designer gene networks: Towards fundamental cellular control. Chaos. 2001;11:207–219. doi: 10.1063/1.1345702. [DOI] [PubMed] [Google Scholar]
- 34.Zhou T, Zhang J, Yuan Z, Chen L. On synchronization of genetic oscillators. Chaos. 2008;18:037126. doi: 10.1063/1.2978183. [DOI] [PubMed] [Google Scholar]


