
Figure 7.
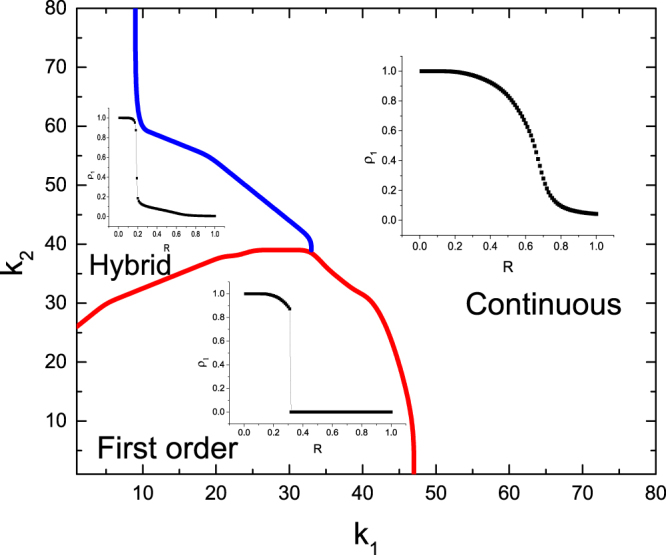
Phase regions in the (k1, k2) plane, where a different sub-region corresponds to a different mode of the relationship between ρ1 and R. The other parameter values are set as in Fig. 6.
Official websites use .gov
A
.gov website belongs to an official
government organization in the United States.
Secure .gov websites use HTTPS
A lock (
) or https:// means you've safely
connected to the .gov website. Share sensitive
information only on official, secure websites.
Phase regions in the (k1, k2) plane, where a different sub-region corresponds to a different mode of the relationship between ρ1 and R. The other parameter values are set as in Fig. 6.