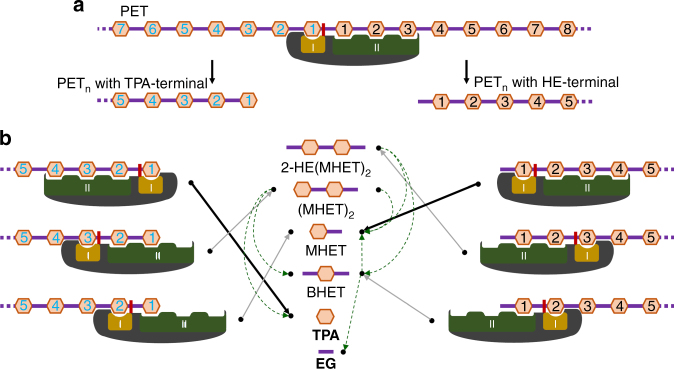
Fig. 4.
Schematic diagram of PET degradation process. a Nick generation step. The TPA and EG moieties of the PET polymer are presented with orange-colored hexagons and purple-colored lines, respectively. IsPETase is shown with a dark-gray color diagram. Subsite I and subsite II of IsPETase are shown as an orange and green-colored diagrams, and labeled as I and II, respectively. The catalytic Ser160 residue is shown as a red-colored rectangle. The PETn polymers with the TPA-terminal and with the HE-terminal are labeled. The TPA moieties of these PETn polymers are labeled by numbers 1, 2, 3, 4, and 5 from each terminal. b Terminal digestion step. Each enzymatic reactions in terminal digestion step is shown as a diagram. The cleaved products from the enzymatic reactions are indicated with black-colored arrows. The light green-colored dotted lines indicate the paths the PET polymer products go for the next reaction. Six PET-related compounds, 2-HE(MHET)2, (MHET)2, MHET, TPA, BHET, and EG, that are cleaved products from terminal digestion step, are shown. The final degradation product (MHET, TPA and EG) are labeled in bold

