Fig. 1.
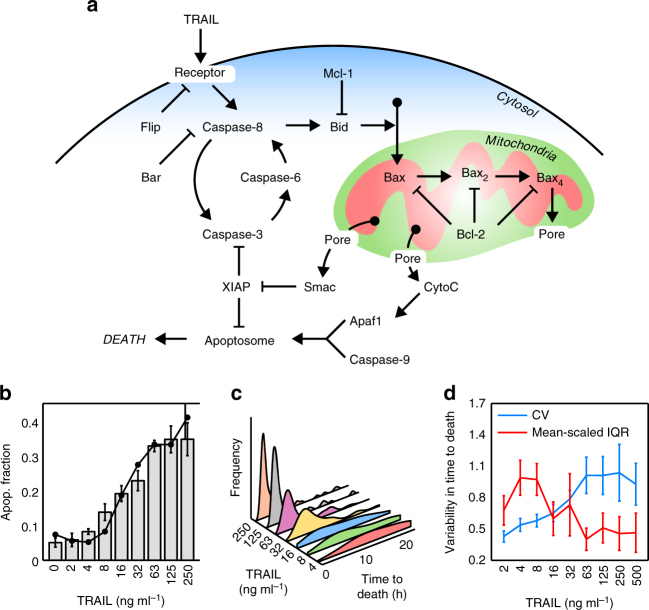
Apoptotic variability in fate and time to death of HeLa cells exposed to TRAIL. a Cartoon of the main protein network of the extrinsic apoptotic pathway. CytoC cytochrome C; Pore, mitochondrial membrane permeabilisation (MOMP); Bax2,4, activation and oligomerisation process of Bax to form the mitochondrial pore. b Apoptotic fraction of HeLa cells after 24 h of TRAIL treatment (0, 2, 4, 8, 16, 32, 63, 125, 250 ng ml−1). Apoptotic cells were quantified by visual inspection of phase contrast images (grey bars) and by FACS using Annexin V (FITC)-PI double staining (black dots). Around 300 cells for each TRAIL dose were inspected to obtain the apoptotic fraction. Error bars are standard deviation of three independent experiments. Data are representative of three independent experiments c Distributions of times to death after TRAIL treatment. Times to death were obtained by tracking cells in 24-h time-lapse experiments. Between 100 and 200 cells were analysed at each TRAIL dose to obtain the distributions. d Analysis of the variability in time to death at different TRAIL doses using two different statistical measures: the coefficient of variation (CV, blue) and the mean-scaled interquartile range (IQR, red). Error bars are computed by bootstrapping

