Fig. 2.

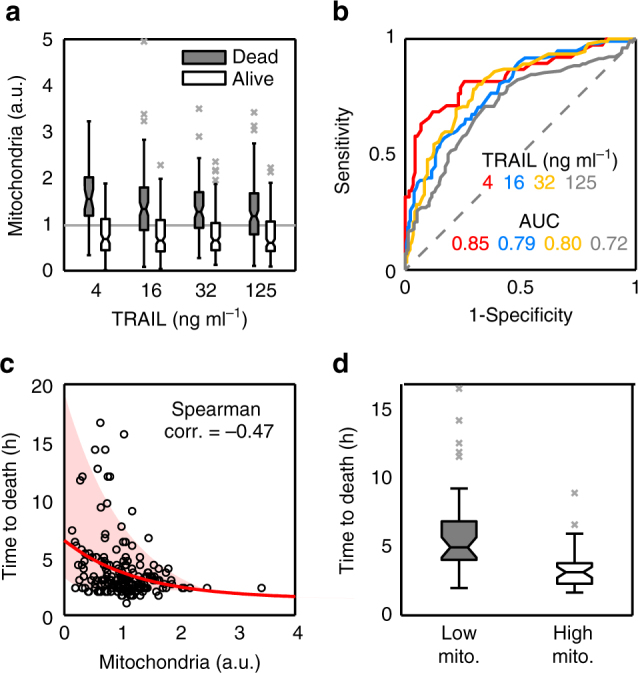
Influence of mitochondrial content on apoptotic cell fate and times to death. HeLa cells stained with MG (as mitochondrial mass marker) were treated with different doses of TRAIL. After TRAIL addition, the cells were imaged for 24 h every 15 min. For each dose, we randomly selected cells from different images, quantified their initial mitochondrial mass by integrating MG intensity, and manually tracked their fate. Typically, we gathered ensembles of 250–300 cells so as to achieve between 100 and 150 apoptotic cells per dose. a Boxplots of mitochondrial levels of alive (white) and dead (grey) HeLa cells after 24 h of treatment. Mitochondrial values are normalised to average (grey line). Data are representative of six independent experiments. b Analysis of mitochondrial content as a binary classifier (death/life) of cell fate. To calculate the performance of mitochondria as classifier, the Receiver Operator Characteristic curve (ROC) and area under the curve (AUC) were represented and calculated for the different TRAIL doses. c Correlation between mitochondrial levels and time to death in apoptotic single cells treated with 32 ng ml−1 of TRAIL. The red line is an exponential fit and the shaded area indicates the confidence region for the fit. d Boxplots of time to death for HeLa cells with mitochondrial levels in the first quartile (Low mito, grey) and in the fourth quartile (High mito, white). Each boxplot was calculated with 30 cells. Boxes cover the range from the lower to the upper quartile of the data. Whiskers indicate maximum and minimum values, excluding outliers which are plotted as individual grey crosses. Horizontal lines inside the boxes represent median values, and notches indicate 95% confidence intervals for the median
