Fig. 4.

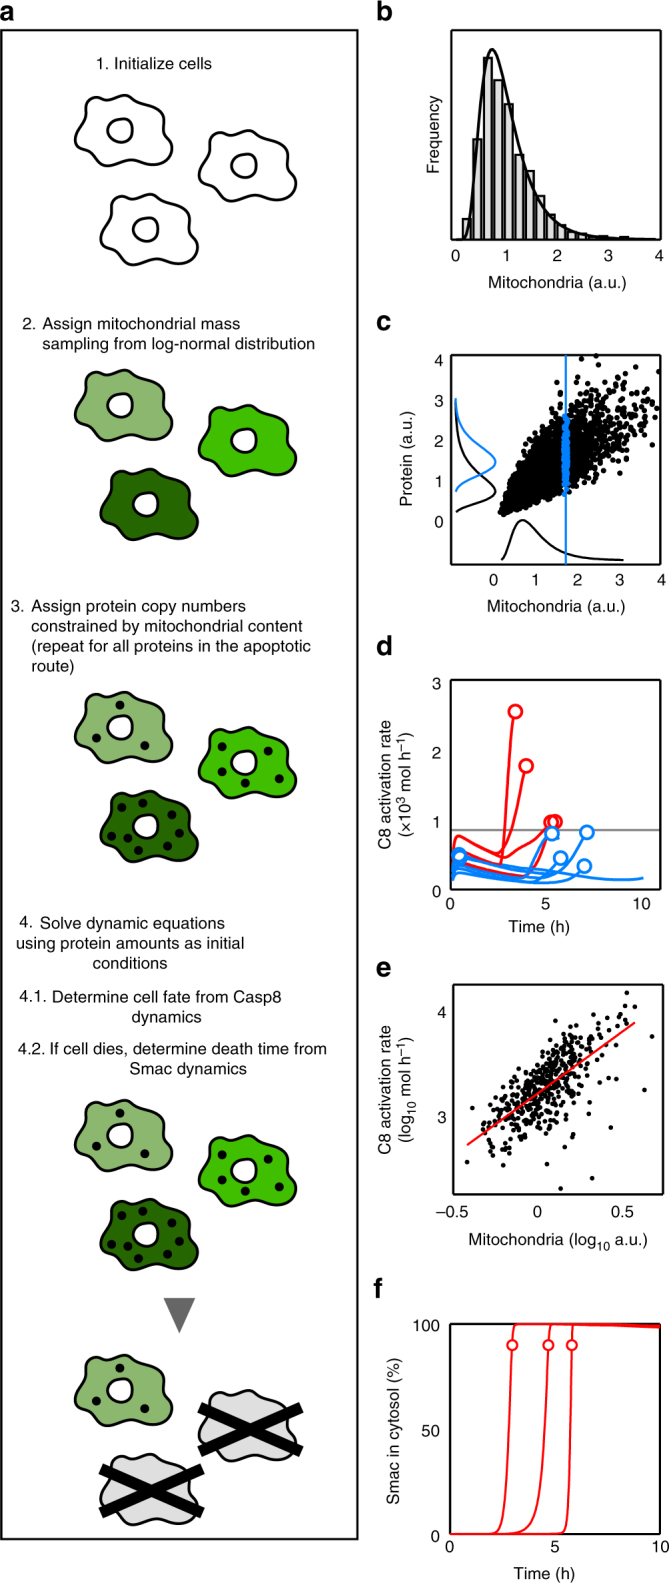
Computational model workflow and key modelling aspects. a Computational model workflow. b Distribution of mitochondrial levels. We initialise a population of cells with heterogeneous mitochondrial levels sampling from a log-normal distribution of mean and width obtained from the experimental CMXRos distribution. c Sampling of initial protein levels. For each protein in the apoptotic pathway, we assign to every cell a protein copy number conditioned by its mitochondrial level. The black line along the vertical axis represents the total protein distribution and the blue line, the protein distribution conditioned by the indicated mitochondrial value (vertical blue line). d Casp8 activation rate. The decision about the cell fate (death/life) is defined by a threshold (horizontal black line) in the rate of Casp8 activation. Cells with maximum activation rates (circles) below the threshold (blue trajectories) are considered as survivors whereas cells that overcome the activation threshold (red lines and circles) are assumed to die after MOMP. e Casp8 maximum activation rate depends on the cell mitochondrial content. Each black dot is a simulated cell (only cells that undergo MOMP before 24 h are shown). The regression line is shown in red. f Smac dynamics. Time to death is defined as the time at which cytosolic Smac reaches 90% of its maximum level
