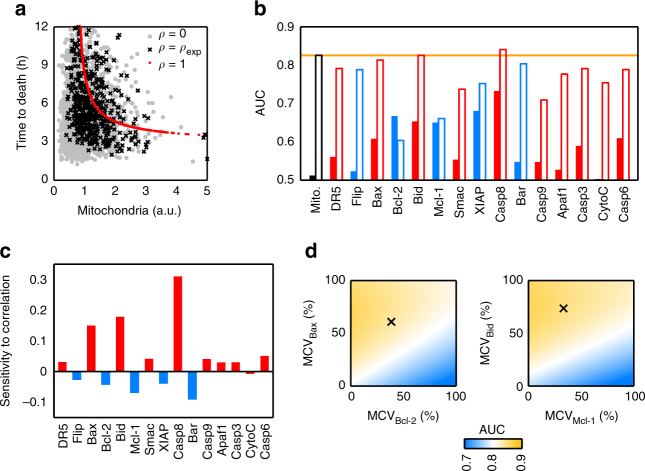
Fig. 6.
Model simulations unveil the effect of protein–mitochondria correlations in the apoptosis outcome. a Effect of global modulation of mitochondria–protein correlations on times to death. Red dots: perfect correlation (ρ = 1) between mitochondria and protein abundances. Black crosses: experimental correlation values (ρ = ρexp). Grey dots: no correlation (ρ = 0). b Performance of apoptosis fate discrimination using each apoptotic protein as a binary classifier. Red bars correspond to pro-apoptotic proteins and blue bars to anti-apoptotic proteins. Hollow bars: including experimental mitochondria–protein correlations. Filled bars: protein variability sampled independently of mitochondrial levels. The discriminatory performance of mitochondria is included in orange as a reference. c Sensitivity of AUC to changes in individual mitochondria–protein correlations. Negative sensitivity corresponds to a situation where increasing a particular mitochondria–protein correlation decreases the discrimination performance. d Discrimination performance as a function of the mitochondrial contribution to protein variability (MCV) for the two pre-MOMP pairs of pro- and anti-apoptotic proteins Bax/Bcl-2 (left panel) and Bid/Mcl-1 (right panel). The black crosses indicate the experimental value of both MCVs. All model simulations in this Figure have been carried out at a sensitive dose (32 ng ml−1). Ensembles of 10,000 cells were used for each simulation

