Figure 3.
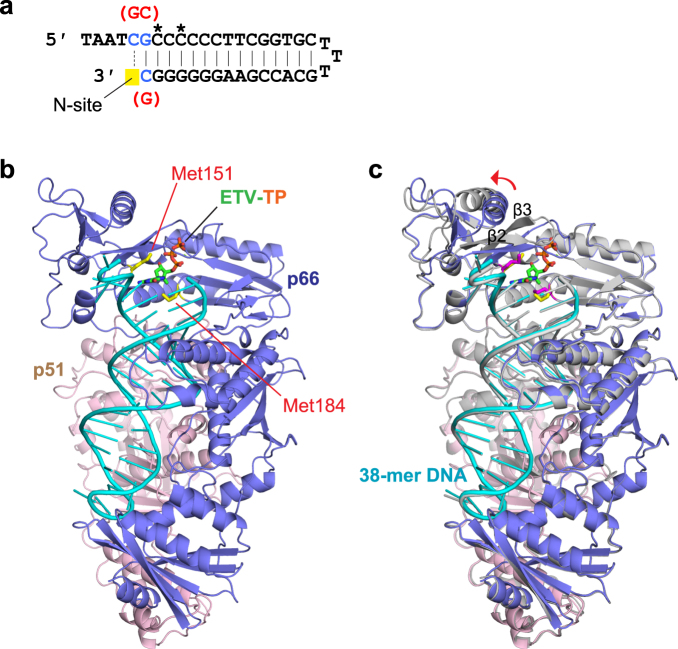
RTQ151M:DNA complex preparation and structure determination. (a) The 38-mer DNA aptamer used in this study. The nucleotides with 2′-O-methyl modification are marked with asterisks. Nucleotide substitutions are colored in blue, and the positions adjusted for the HIV-1 RT N-site are highlighted in yellow. The original nucleotides reported by Miller et al.27 are also indicated in red. (b) Ribbon representation showing the overall structures of the RTQ151M:DNA:ETV-TP ternary complex, and (c) the superimposition of the RTQ151M:DNA binary and RTQ151M:DNA:ETV-TP ternary complexes. The p66, p51, and DNA of the ternary complex are colored in blue, pink, and cyan, respectively. All models of the binary complex are colored in gray. The side-chains of Met151 and Met184 of the ternary complex are shown as stick models and colored in yellow. The side-chains of Met151 and Met184 of the binary complex are shown in magenta. The bound ETV-TP is also shown as a stick model. The structural difference at the finger domain including the β2-β3 region is indicated by a red arrow.

