Fig. 5.
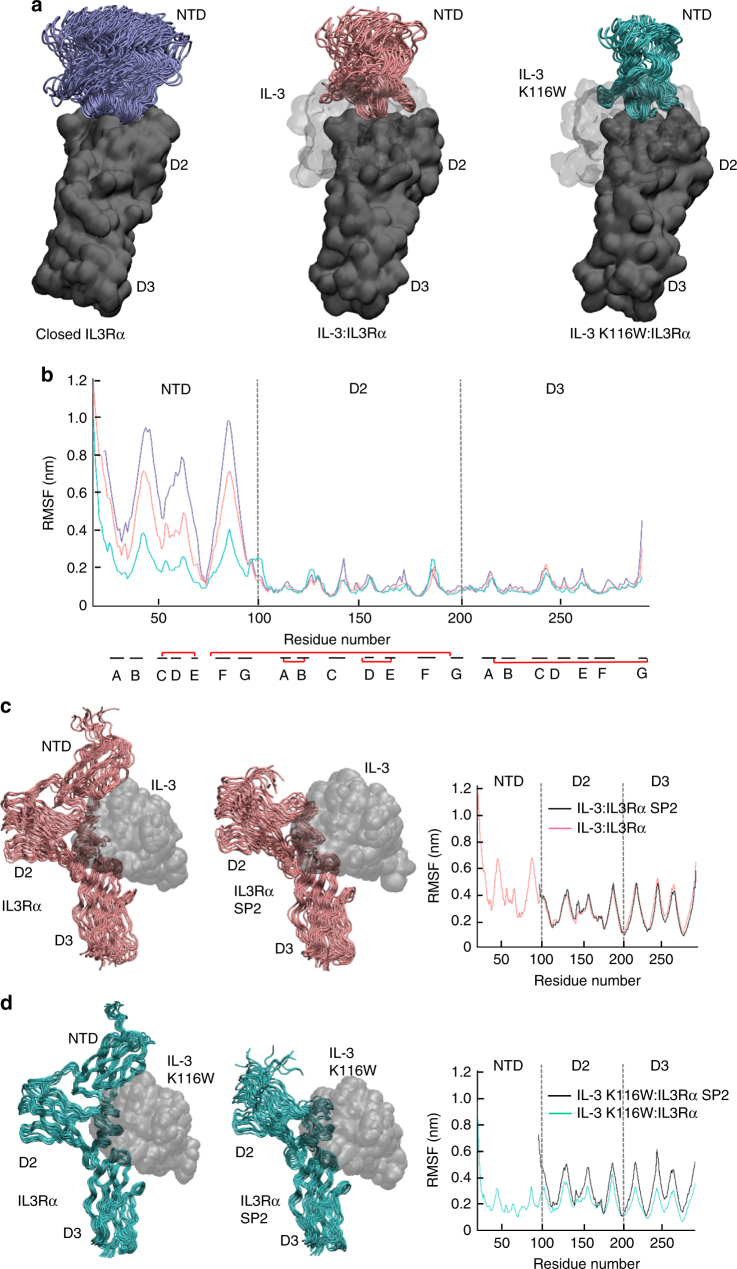
Ensemble of IL3Rα MD simulations in isolation and in complex with wild-type IL-3 and IL-3 K116W. a Snapshots from 75 ns (unliganded/apo IL3Rα) and 100 ns (binary complexes) MD simulations overlaid via the IL3Rα CRM (ie, D2–D3). The mobility of the NTD progressively decreases when going from the unliganded/apo IL3Rα (purple NTD, left), to the wild-type IL-3 binary complex (pink NTD, middle) and then to the IL-3 K116W binary complex (green NTD, right). The IL3Rα CRM is shown as a dark grey molecular surface, the NTD is shown as a cartoon and the cytokine is depicted as a light grey molecular surface. b Root-mean-square fluctuation (RMSF) of the Cα atoms in IL3Rα provides a measure of atom mobility around its average position during the simulation. The data demonstrates that IL-3 K116W stabilises the NTD in the binary complex. Colour scheme and IL3Rα alignment as for a. The location of the β-strands (black lines) and the disulphide bonds (red lines) are shown below the X-axis. c Comparison of full-length IL3Rα vs IL3Rα SP2 mobility in the wild-type IL-3 binary complex. Snapshots from the 100 ns MD simulations overlaid via the cytokine (grey molecular surface). IL3Rα shown as a pink cartoon. Loss of the NTD has little impact upon the conformational mobility of the α-subunit. d Comparison of full-length IL3Rα vs IL3Rα SP2 mobility in the IL-3 K116W binary complex. Snapshots from the 100 ns MD simulations overlaid via the cytokine (grey molecular surface). IL3Rα shown as a green cartoon. Loss of the NTD has a visible negative impact upon the conformational mobility of the α-subunit and it now resembles the wild-type IL-3 system shown in c

