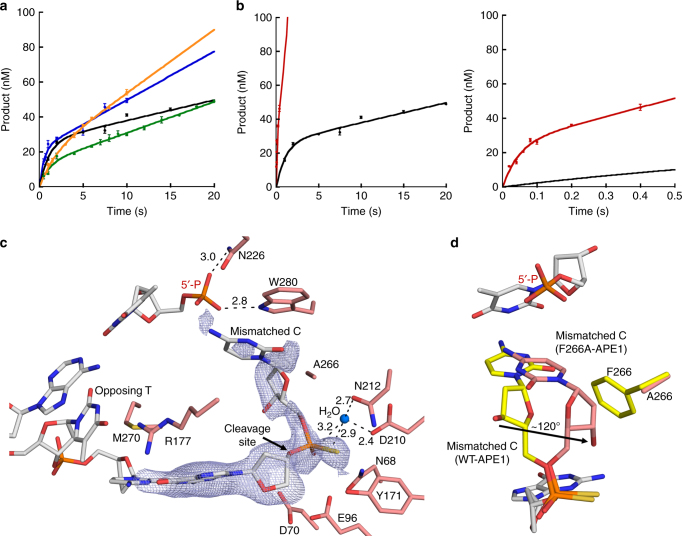
Fig. 6.
Kinetic and mutant characterization of the APE1 exo reaction. a Pre-steady-state kinetic time courses for the APE1 exo reaction are shown in the left panel. Curves shown are for WT APE1 (black), M270A (blue), R177A (green), and W280A (orange). b Time course of product formation for F266A (red) in comparison to WT (black). The early time points are shown in the right panel. For all time courses, the line represents the best fit to an equation with a rising exponential and linear term. Kinetic parameters are shown in Table 2. All error bars represent the standard error of the mean from three replications of the experiment. c Structure of the F266A mutant exo substrate complex active site. 2Fo–Fc map density (1σ) is shown in light blue. d An overlay of the F266A exo substrate structure (salmon) with the WT substrate structure (light gray DNA, yellow protein). An arrow indicates the rotation of the 3ʹ mismatch sugar moiety. Key residues, the site of cleavage, and distances (Å) are indicated

