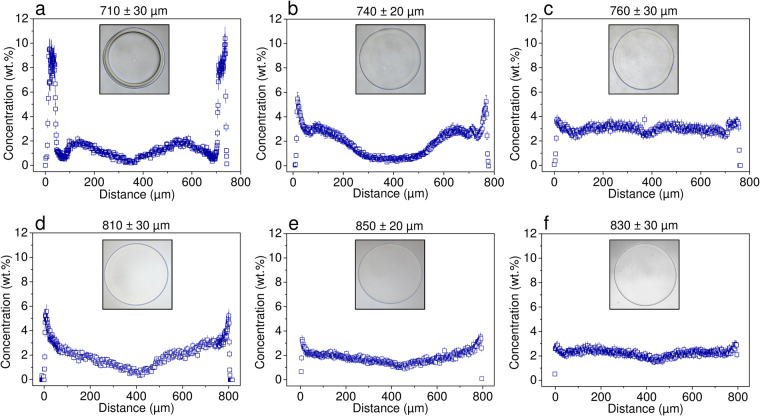
Figure 2.
The effect of environment on spatial distribution of alginate (in wt.%) in alginate microbeads of higher (a–c) and lower (d–f) initial heterogeneity as revealed by quantitative CRM imaging. (a,d) Microbeads after preparation (in D-mannitol). (b,e) Microbeads stored for 24 hours in saline at 37 °C. (c,f) Microbeads after explantation from nude mice 4 weeks post-intraperitoneal implantation (stored in saline with 2 mM CaCl2). The optical microscopy images are included to visualize the particular alginate microbeads characterized by CRM imaging. The numbers refer to the microbead diameter.

