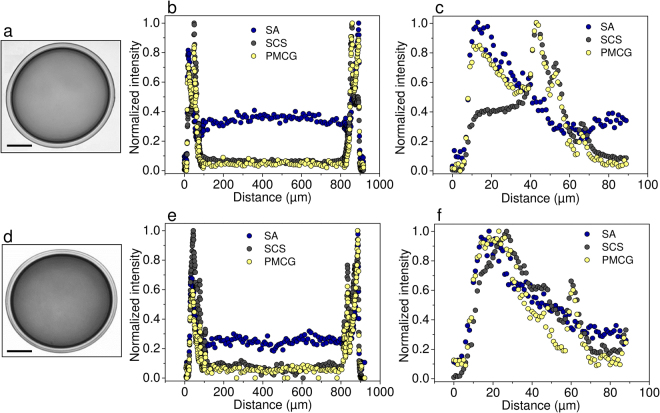
Figure 3.
CRM intensity profiles (equatorial cross-section) of a multi-component microsphere (SA/SCS-PMCG) after preparation (a–c), and after explantation from the intraperitoneal space of C57bl/6 mice 2 weeks post-implantation (d–f). (a,d) Optical image (bar equals to 200 µm). Spatial distribution of individual polymeric components within the entire microcapsule (b,e) and in the outermost region only (c,f) obtained from Raman signal normalized to the maximum intensity.

