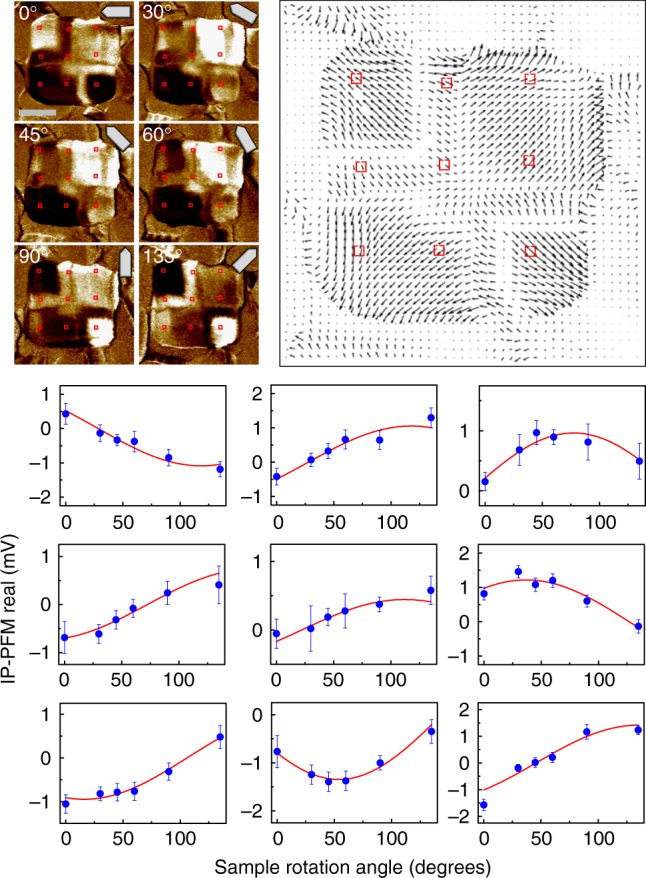
Fig. 2.

Construction of an IP piezoresponse vector map. IP PFM real part contrast images of a BFO nanoplate in the as-grown state of the type 2. As the IP PFM measurement can detect the perpendicular component to cantilever orientation, it is necessary to collect angle-dependent IP PFM signals at each position, in order to determine both the magnitude and direction of an IP piezoresponse vector. Angle-dependent IP PFM signals were fitted to a trigonometric curve at the representative positions marked by red rectangles. The amplitude and phase information of the fitting curve determine the amplitude and direction of the IP piezoresponse vector, respectively. A data point in the graph consists of an average value of 5 × 5 pixels in the PFM image and the error bar is defined by half of the difference between the maximum value and the minimum value within 5 × 5 pixels. The scale bar in the IP PFM image represents 200 nm
