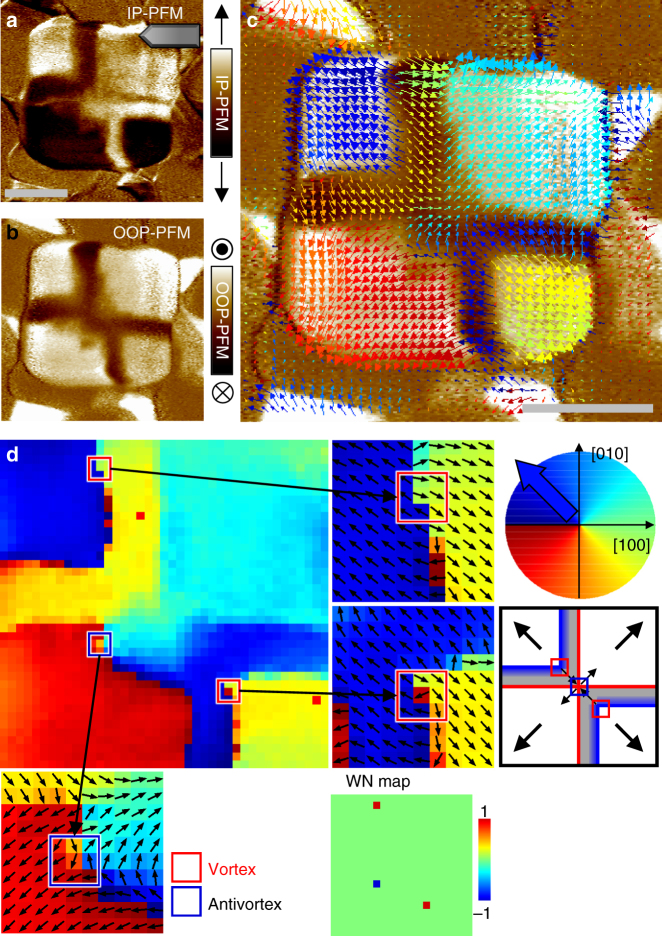
Fig. 3.
Observation of the vortex and antivortex points in a BFO nanoplate in an as-grown state by angle-resolved PFM measurements. a IP PFM image was measured at a tip orientation described by the illustration at the upper right corner. The bright (dark) contrast represents the IP piezoresponse vector component perpendicular to the tip orientation, i.e., pointing to the positive (negative) vertical direction. b OOP PFM image simultaneously measured. Most areas inside the plate region exhibit upward polarisation except for the buffer domains, in which a weak piezoresponse (shown in brown) was detected. c Map of local IP piezoresponse vectors. This map was constructed by combining the six IP PFM images measured with different tip orientation angles. Each colour arrow represents the direction of the piezoresponse vector as depicted in the coloured circle in d. The locations of the buffer domains indicate that this nanoplate corresponds to the type 2 configuration (Fig. 5c). d Colour map indicates the direction (angle) of IP piezoresponse vector. We tiled small-closed square (3 × 3) loops by overlapping their edges and calculated the winding number at each loop, thereby constructing the winding number map (WN map). Most areas appeared to have a winding number of 0, except for two vortices (red boxes; each + 1) and one antivortex (blue box; each − 1), as depicted in the schematic on the right-hand side. This as-grown domain configuration consists of upward polarisations in all quadrant domains, and topologically it results in a total winding number of 1. Scale bars represent 200 nm

