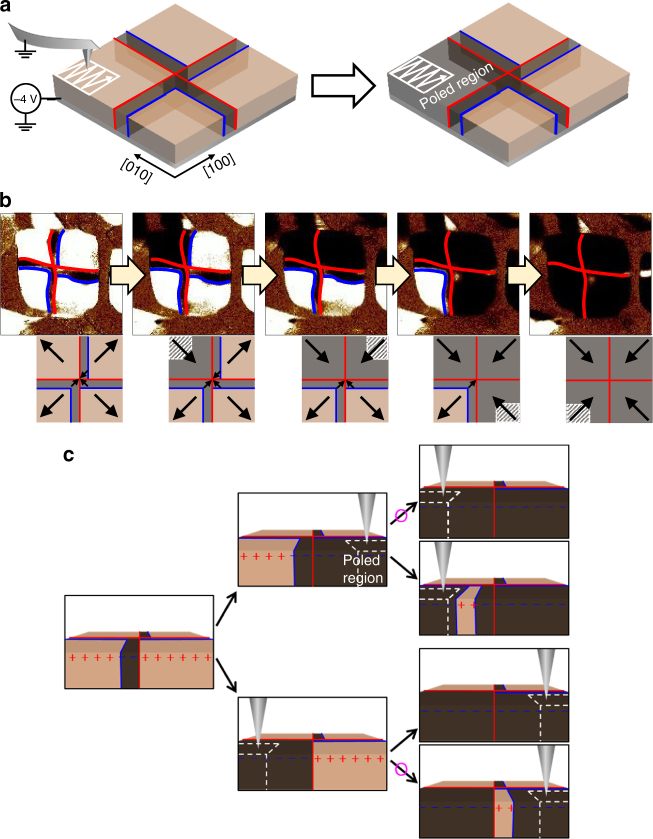
Fig. 6.
Non-local domain switching to control quadrant and buffer domains. a Schematic of a non-local switching process. b OOP PFM images showing domain switching one by one in a clockwise direction. The red and blue lines representing ferroelastic and ferroelectric domain walls, respectively. They were determined together with simultaneously measured IP PFM images (not shown here). c Buffer domain can be written or erased by control of the switching sequence. The pink circles indicate feasible routes verified by experiments

