Table 1.
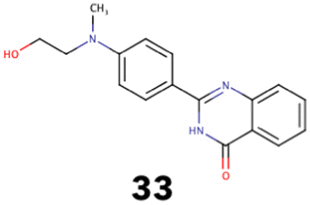
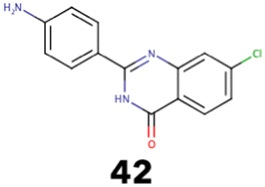
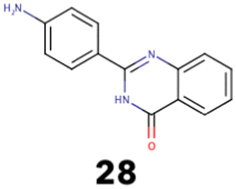
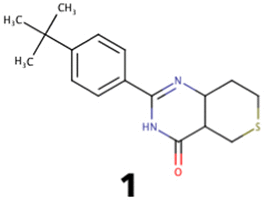
Kinase profiling using selected TNKS inhibitors at 10 μM. Dose response was measured for selected kinase-inhibitor pairs and inhibition-% or an IC50 is shown.
| Compound | CDK9 | Akt | p42 | p38 | GSK3β | CK2 | TNKS2 |
|---|---|---|---|---|---|---|---|
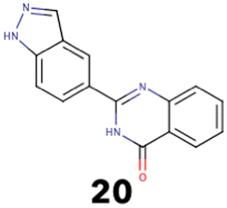
|
34% | 1% | 14% | 3% | 57% | 12% | 400 nM |
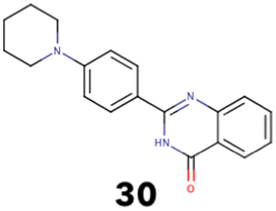
|
31% | 2% | 3% | 3% | 11% | 1% | 15 nM |
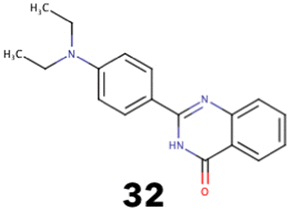
|
16% | 48% | 18% | 20% | 4% | 2% | 10 nM |
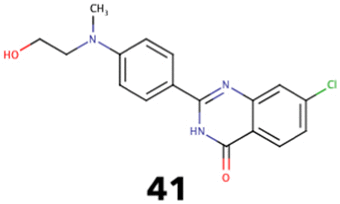
|
6.2 µM | 14.7 µM | — | — | — | — | 660 nM |
|
16.1 µM* | 13.3 µM | — | — | — | — | 16 nM |
|
3.4 µM | 1.6 µM | 51% | 45% | 41% | 2% | 1,050 nM |
|
28.3 µM* | 13.8 µM | — | — | — | — | 145 nM |
|
12% | 7% | 2% | 3% | 7% | 1% | 5 nM |
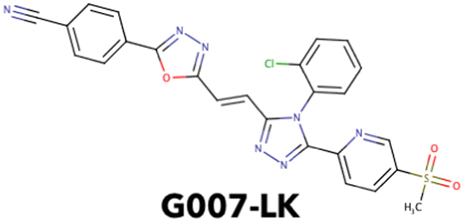
|
9% | 1% | 3% | 3% | 3% | 1% | 25 nM |
TNKS2 IC50 values are shown for comparison.
*The compound does not completely inhibit the enzyme at concentrations used. IC50 value extrapolated by the analysis software might be not accurately estimated.
