
Figure 4.
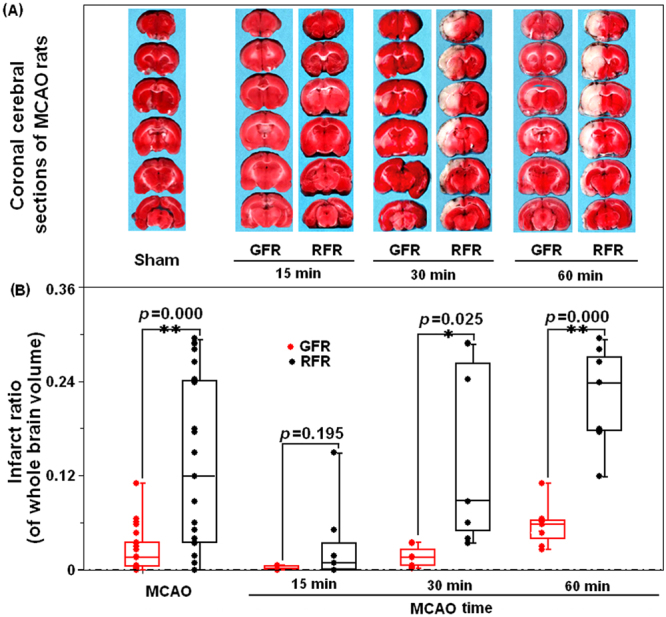
Comparison of ischemic lesion volume of brain in MCAO rats undergoing GFR and RFR intervention. (A) Representative TTC stained coronal sections indicating areas of healthy tissue (red) and ischemic injury (white) for each group. Compared with RFR group, the GFR could restrain the brain injury induced by different intervals of MCAO, which was represented as the significantly decreased area of while color. (B) Total volumes of ischemic lesion in the ipsilateral hemisphere, expressed as a percentage of the total brain volume, were compared in the GFR and RFR groups after 15-, 30- and 60-minute MCAO treatments. Each value was presented as dot plot of the raw data, overlaid by box and whisker plot (median, first and third percentile, range). Significance was determined by independent Student’s t test. *p < 0.05 and **p < 0.01 represent the statistical significance of ischemic lesion volume in GFR-treated group compared with that in RFR-treated group.