Figure 6.

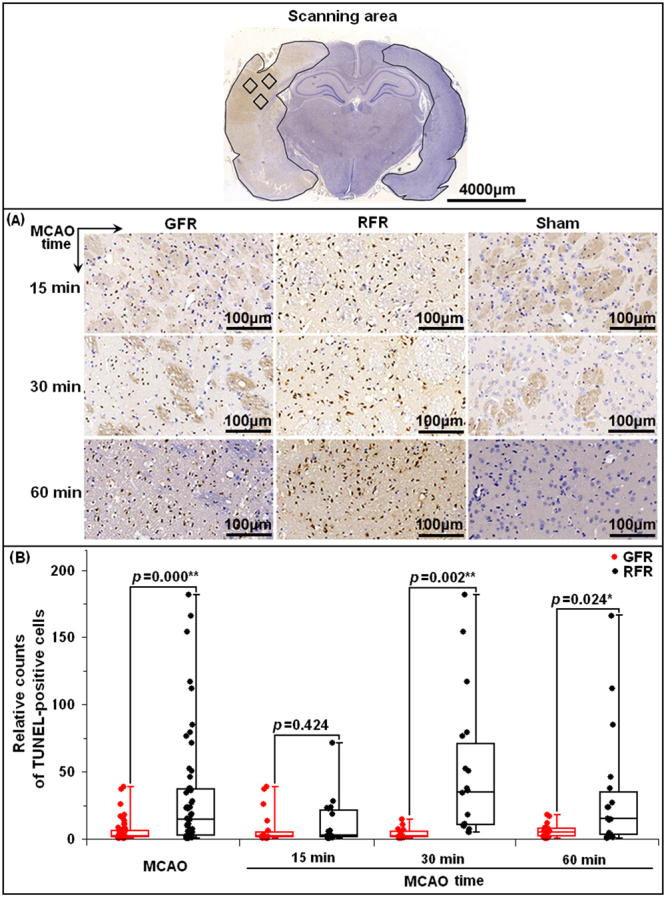
Neuronal apoptosis of ischemic cortex in MCAO rats undergoing GFR and RFR intervention. (A) Representative photomicrographs of TUNEL-positive cells (brown staining) in the MCA territory of the ischemic cortex (magnification 400×) after 15, 30 and 60 min MCAO of rats in GFR and RFR intervention. Scale bar = 100 μm. (B) Comparison of neuronal apoptosis of rats following GFR and RFR treatment after 15-, 30- and 60-minute MCAO. The TUNEL-positive cells were quantified by NuclearQuant module software (3D, HISTECH Ltd., Budapest, Hungary) and represented as dot plot of the raw data, overlaid by box and whisker plot (median, first and third percentile, range). Significance was determined by independent Student’s t test. *p < 0.05 and **p < 0.01 means statistical significance in GFR group versus RFR group.
