Figure 2.

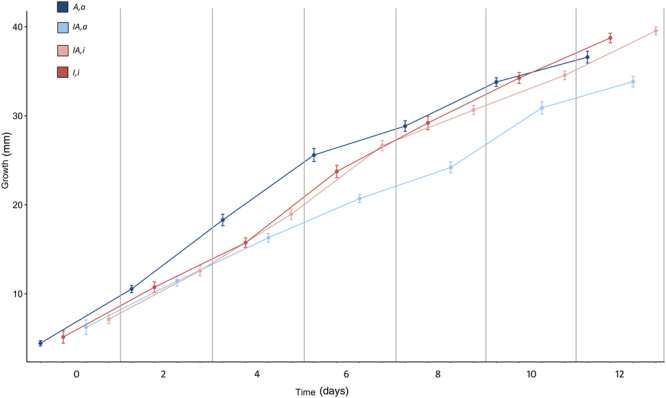
Growth curves of the four genotypes during saprobic assay. Each line represents the average of ten replicates. Error bars indicate ± Standard Deviation (SD). Points of x-axis were offset to improve the readability.

Growth curves of the four genotypes during saprobic assay. Each line represents the average of ten replicates. Error bars indicate ± Standard Deviation (SD). Points of x-axis were offset to improve the readability.