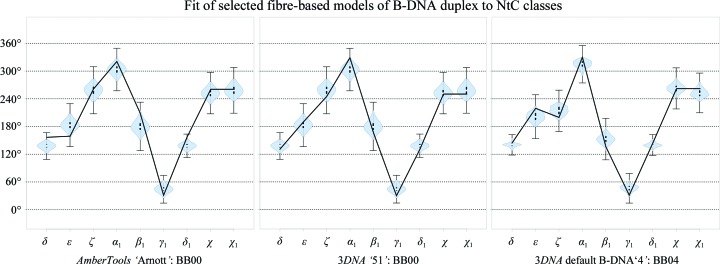
Figure 7.
NtC classes assigned to three B-DNA duplex models derived from fibre data: the ‘Arnott’ model from Nucleic Acid Builder of AmberTools14 (Salomon-Ferrer et al., 2013 ▸) and the models numbered ‘51’ and ‘4’ from 3DNA (Lu & Olson, 2008 ▸). The black line connects torsion values for the particular model. The small blue histograms (‘violin plots’) show the distributions of the torsion values of the assigned NtC in the golden set; the vertical grey bars show their total span. A detailed explanation of the graphs is given in Černý et al. (2016 ▸) and at https://dnatco.org. The assignment of more fibre models is shown in Supplementary Fig. S4 and Table S5.

