Fig. 1.
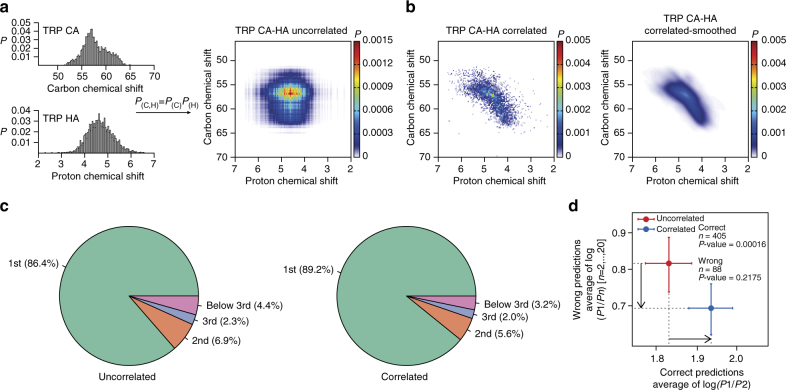
Comparison of uncorrelated and correlated chemical shifts probabilities and their power in amino acid-type prediction. a The 1D probability distributions for the Cα and Hα atoms of Trp (left) and their joint probability distribution (right). b The 2D probability distribution of correlated Cα–Hα chemical shifts of Trp (left) and the corresponding smoothed 2D probability density map (right) after applying a Gaussian kernel function. Graphs were generated from the VASCO database with a bin size of 0.04 p.p.m. for protons and 0.2 p.p.m. for carbons. The color gradient scaling differs for (a) uncorrelated and (b) correlated distributions. c Pie charts displaying the ranking of amino acid-type predictions in the current dataset (four proteins) using uncorrelated (left) or correlated distributions (right) of 13C–1H chemical shifts. d Analysis of common (correct or wrong) predictions made by using uncorrelated (red) or correlated distributions (blue) of 13C–1H chemical shifts. Horizontal axis plots the mean value and standard error of correct predictions (P1) to the second probable (P2), and vertical axis plots the mean value and standard error of wrong predictions (Pn) to the first probable (P1). Pairwise t-test shows that the improvement in predictions made by using correlated instead of uncorrelated 13C–1H chemical shifts (arrows) is statistically significant for the correct ones (P-value = 0.00016) but not for the wrong ones (P-value = 0.2175). The discrepancy is attributed to the relatively small number of wrong predictions available for the test (405 vs 88)

