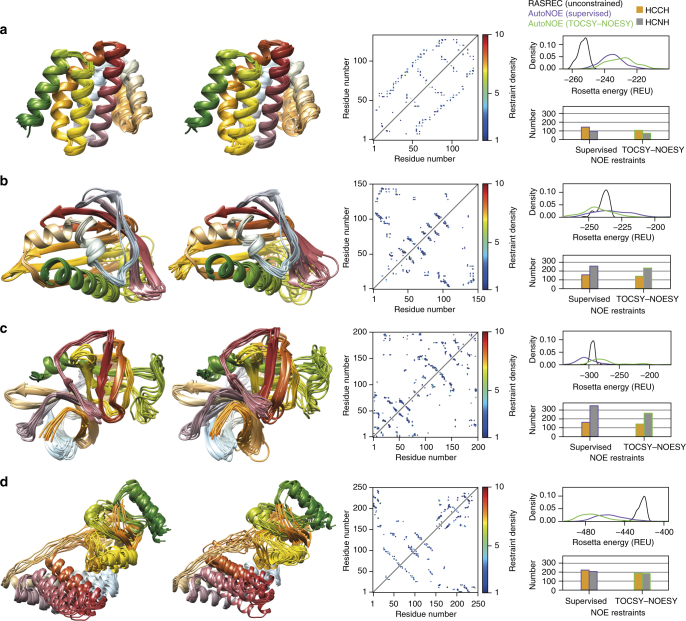
Fig. 5.
Comparison of structural ensembles calculated from supervised versus fully automated assignments. a Rtt103 (RTT, 133 aa), b KanY (ms6282, 145 aa), c α-lytic protease (aLP, 198 aa) and d Enzyme I (nEIt, 248 aa). Columns 1 and 2: autoNOE-Rosetta ensembles of 10 lowest-energy structures guided by “best effort” supervised assignments or by automated 4D-CHAINS assignments (TOCSY–NOESY), respectively. Column 3: Sequence map of distance restraints assigned by autoNOE-Rosetta in iterative structure refinement calculations. Here, the upper triangular region shows restraints obtained using supervised assignments, while the lower triangular region using automated 4D-CHAINS assignments. Column 4: Rosetta energy (in Rosetta Energy Units (REU)) distributions and total numbers of assigned long-range restraints. The energy distribution was computed from the 100 lowest-energy structures sampled during the final stage of autoNOE-Rosetta calculations using supervised assignments (purple), 4D-CHAINS assignments (green) and chemical shift fragment-based RASREC-Rosetta calculations without NOEs (black). The bars represent the total number of HCNH (amide to aliphatic) and HCCH (aliphatic to aliphatic) long-range NOE restraints assigned by autoNOE-Rosetta, including ambiguous restraints derived for different stereo-specific groups. RDCs were used to obtain converged Enzyme I structures with respect to the orientation of the two domains reported in row d. Images of structural ensembles were produced using Chimera (https://www.cgl.ucsf.edu/chimera)

