Fig. 6.
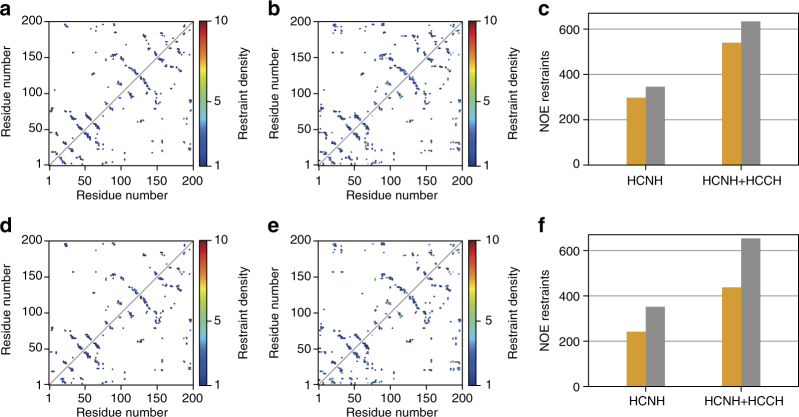
Comparison of assigned NOE contacts versus predicted from X-ray structure. Contacts shown as a function of residue pairs along the sequence of α-lytic protease. Upper triangular region shows NOE contacts identified during iterative structure refinement by autoNOE-Rosetta, while that of lower triangular region represents expected contacts as predicted from the X-ray structure (PDB ID 1P01) using a 5.5 Å distance cutoff between all possible proton atom pairs and further removing redundancies due to chemically equivalent protons. Different combinations of input assignments and NOE datasets used are shown as follows. a Supervised assignments with HCNH NOEs. b Supervised assignments with HCNH+HCCH NOEs. c Total number of NOE restraints assigned in a and b (orange) versus predicted from X-ray structure (gray). d 4D-CHAINS TOCSY-NOESY automated assignments with HCNH NOEs. e 4D-CHAINS TOCSY–NOESY automated assignments with HCNH+HCCH NOEs. f Total number of NOE restraints assigned in d and e (orange) versus predicted from X-ray structure (gray)

