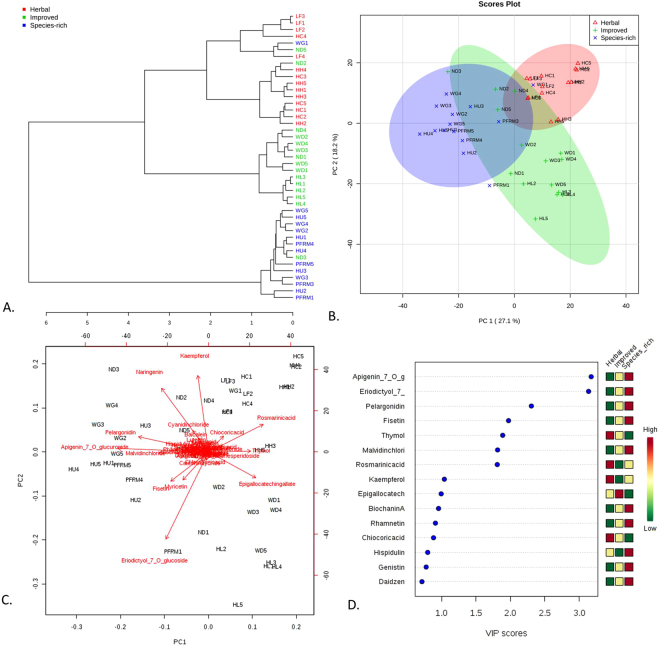
Figure 3.
Forage phytochemical composition is influenced by grassland type. (A) Dendrogram showing the relationship among the samples using Euclidean distances and Ward clustering. (B) PCA plot showing the spatial division among grassland types. (C) Biplot of the PCA plot in Fig. 3B showing the compounds most responsible for the divergence among grassland types. (D) Key compounds separating the grassland types based on variable importance in projection (VIP) in PLS-DA analysis.

