Fig. 3.
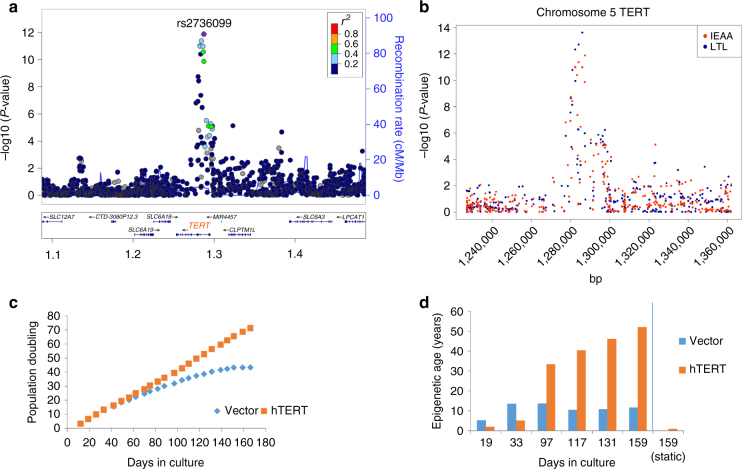
Genetic analysis of the 5p15.33 TERT locus and in vitro studies of hTERT in fibroblasts. a Regional association plot of locus associated with IEAA. The y-axis depicts log-transformed meta-analysis P-values across all studies 1–15. The colors visualize linkage disequilibrium (LD) r2 between rs2736099 (colored in purple) and neighboring SNPs. b TERT-locus association with IEAA (marked in red) overlaid with the association with leukocyte telomere length (LTL) given by Bojesen et al.25 (marked in blue). Note that several SNPs in the TERT locus are associated with both IEAA and leukocyte telomere length at a genome-wide significant level. c Growth of human primary fibroblasts (n = 46) represented as population doublings (y-axis) vs. days in culture (x-axis). d Adjusted epigenetic age of n = 14 individual samples (y-axis) vs. days in culture (x-axis). The adjusted age estimate was defined as difference between Horvath DNAm age minus 28 years, since the former exhibited a substantial offset in fibroblasts. DNAm ages are increased in the hTERT expressing cells in the four later time points (days 97, 117, 131, and 159) resulting in a paired Student's t-test P-value of 0.043. However, no increase in DNAm age can be observed in cells that are static (last bar)

