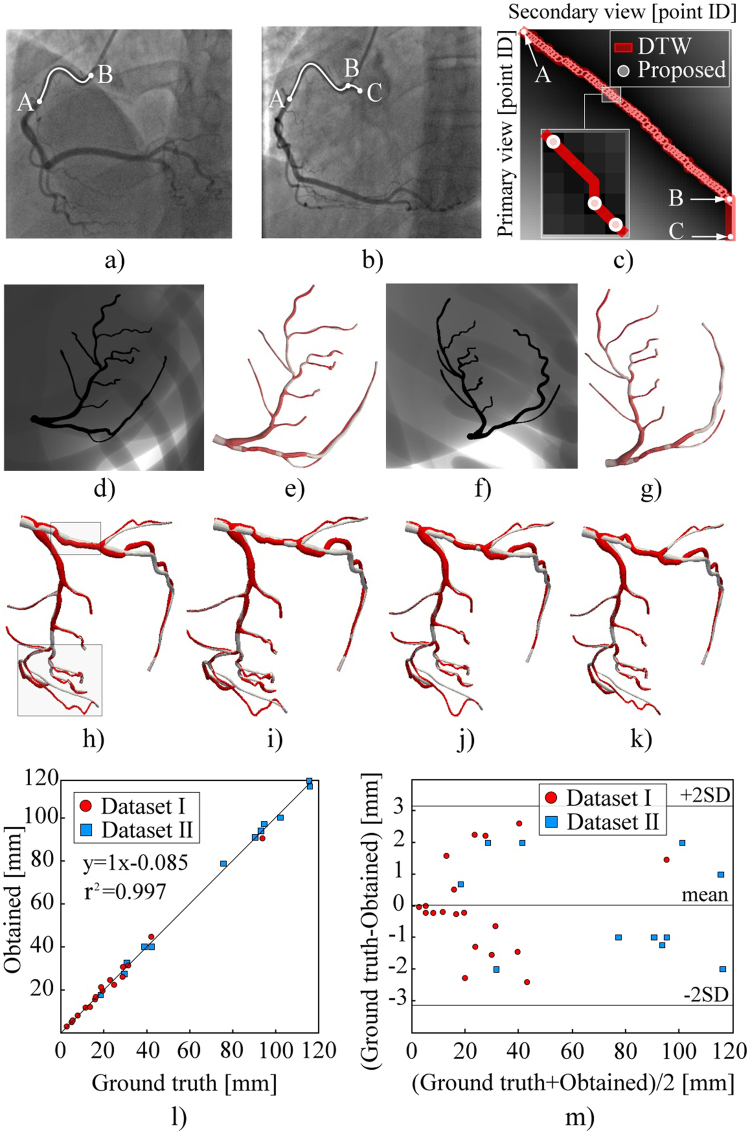
Figure 11.
Assessment of CA centerline reconstructions. (a–k) Demonstration of the partial-matching ability to skip false candidate points during the segmentation of input centerlines. (a) Correctly segmented CA branch. (b) Overestimated CA branch (AC was extracted instead of AB). (c) Point-correspondence matrix for the XRA views shown on (a) and (b). (d–g) Results from the views of acquisitions. (h–k) Results from an arbitrary view during cardiac cycle. (l) Correlation of the obtained and true centerlines lengths. (m) Bland–Altman plot of the obtained and true branch lengths.

