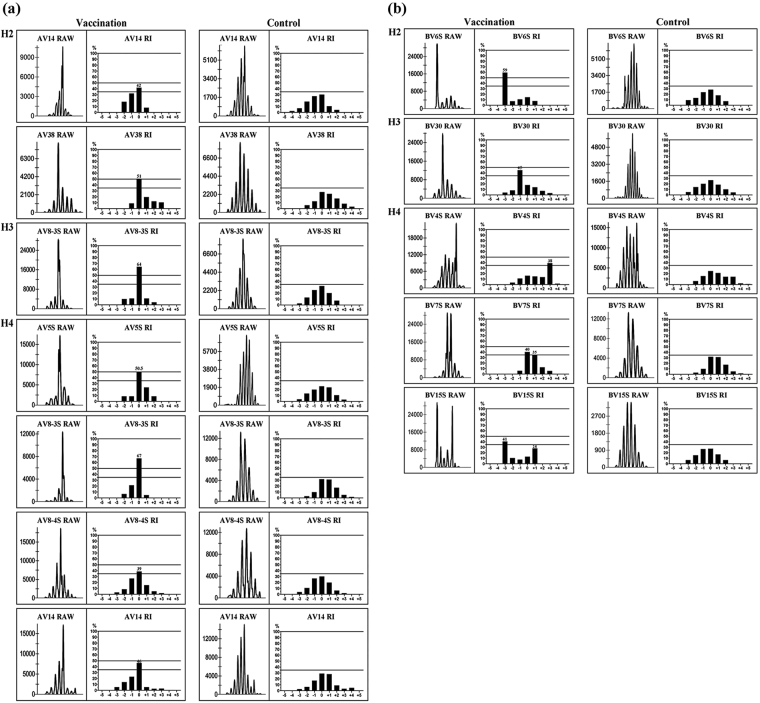
Figure 4.
Clonal expansions of TCR AV and BV gene families in CD4+ T cells from pigs immunised with C-strain vaccine. Vα/β families with clonal expansions are depicted for post immunisation (left column) and before immunisation (recognized as control, right column). In each column, CDR3 size profiles and fluorescence intensity of selected families are shown on the left and RI value for each peak on the right. Numbers from −5 to +5 correspond to normally distributed CDR3 profiles from pigs before immunisation, where 0 is the major central peak. Data are shown as RI, calculated as each peak are against the total peak area. (a) TCR AV gene families showing evidence of clonal expansions. (b) TCR BV gene families showing evidence of clonal expansions.

