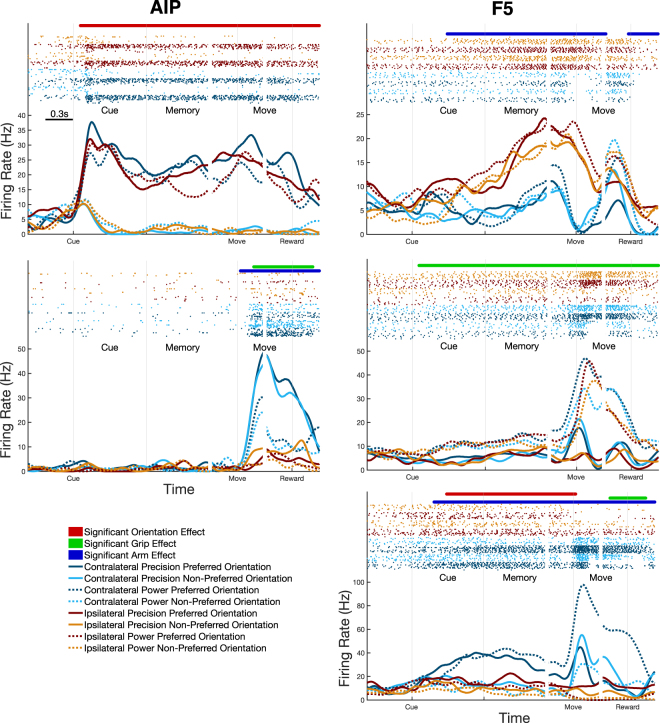
Figure 2.
Example average firing rate curves of single-units in AIP and F5. (Top Left) A unit tuned to a single orientation of the handle throughout the trial, even in darkness. (Middle Left) A unit tuned only during movement both for the grip performed and the hand used. (Top Right) A unit tuned for hand used through the trial, showing a preference for ipsi-lateral movements. (Middle Right) A unit tuned for performed grip throughout the trial. (Bottom Right) A unit tuned for all task factors at different points in the trial. Data were aligned to three events, cue onset, movement onset, and reward. Raster plots above curves show single spikes over all trials of each condition. Significance bars represent tuning for each of the three factors, as determined by cluster-based permutation test (p < 0.05, corrected for number of factors). Examples were taken from both monkeys.

