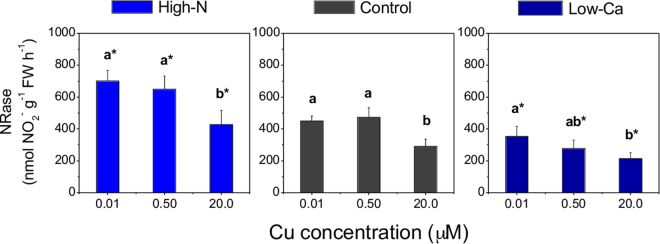
Figure 3.
Nitrate reductase (NRase) activity in leaves of Swingle citrumelo seedlings, grown in nutrient solution with different levels of nitrogen (N; Experiment 1) or calcium (Ca; Experiment 2), and followed by15 days in various copper (Cu) concentrations. Legend: high-N: 16.4 mM N; Control: 9.4 mM N and 5.7 mM Ca; low-Ca: 1.0 mM Ca; Means of Cu levels followed by different lowercase letters are significantly different by Tukey’s test (p < 0.05). Copper levels between High-N and Control or between Low-Ca and Control followed by an asterisk (*) are significantly different by Tukey’s test (p < 0.05).

