Fig. 2.
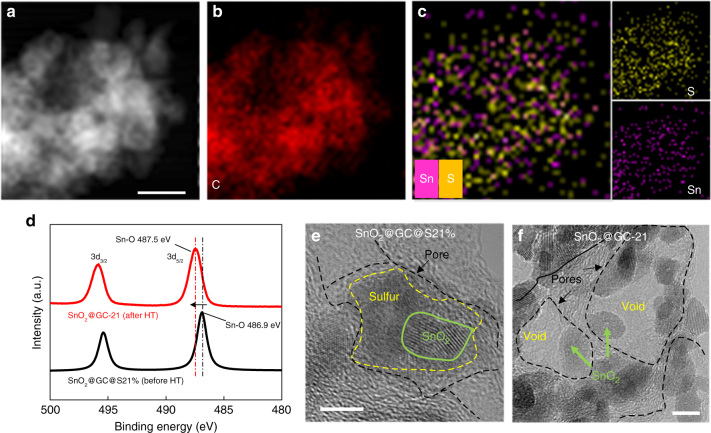
Characterization of the state of the sulfur and the SnO2 NPs in the 3D graphene cages. a STEM and b, c EDS of SnO2@GC@S21% before heat treatment (HT) showing the distribution of elemental C, S and Sn, especially the distribution of S and Sn. d Sn 3d XPS spectra with a 0.6 eV shift between SnO2@GC-21 (after HT) and SnO2@GC@S21% (before HT). e HRTEM image of SnO2@GC@S21%. f HRTEM image of SnO2@GC-21. Scale bars: a 100 nm; e, f 5 nm

