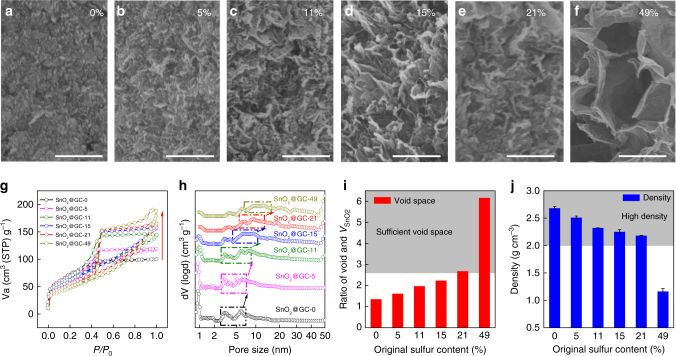
Fig. 3.
Tuning the void space of SnO2@GCs at the nanoscale. a–f SEM images showing the more expanded structure of SnO2@GCs containing increasing amounts of sulfur (0, 5, 11, 15, 21, 49%) after it has all been removed. g Nitrogen adsorption–desorption isotherms, and h pore size distributions of SnO2@GCs showing that the pore structure changes and pore size increases as the original sulfur content increases. i Calculated void space and j density changes as a result of removing the sulfur from the six samples. Error bars indicate s.d. (n = 3). Scale bars: a–f 500 nm

