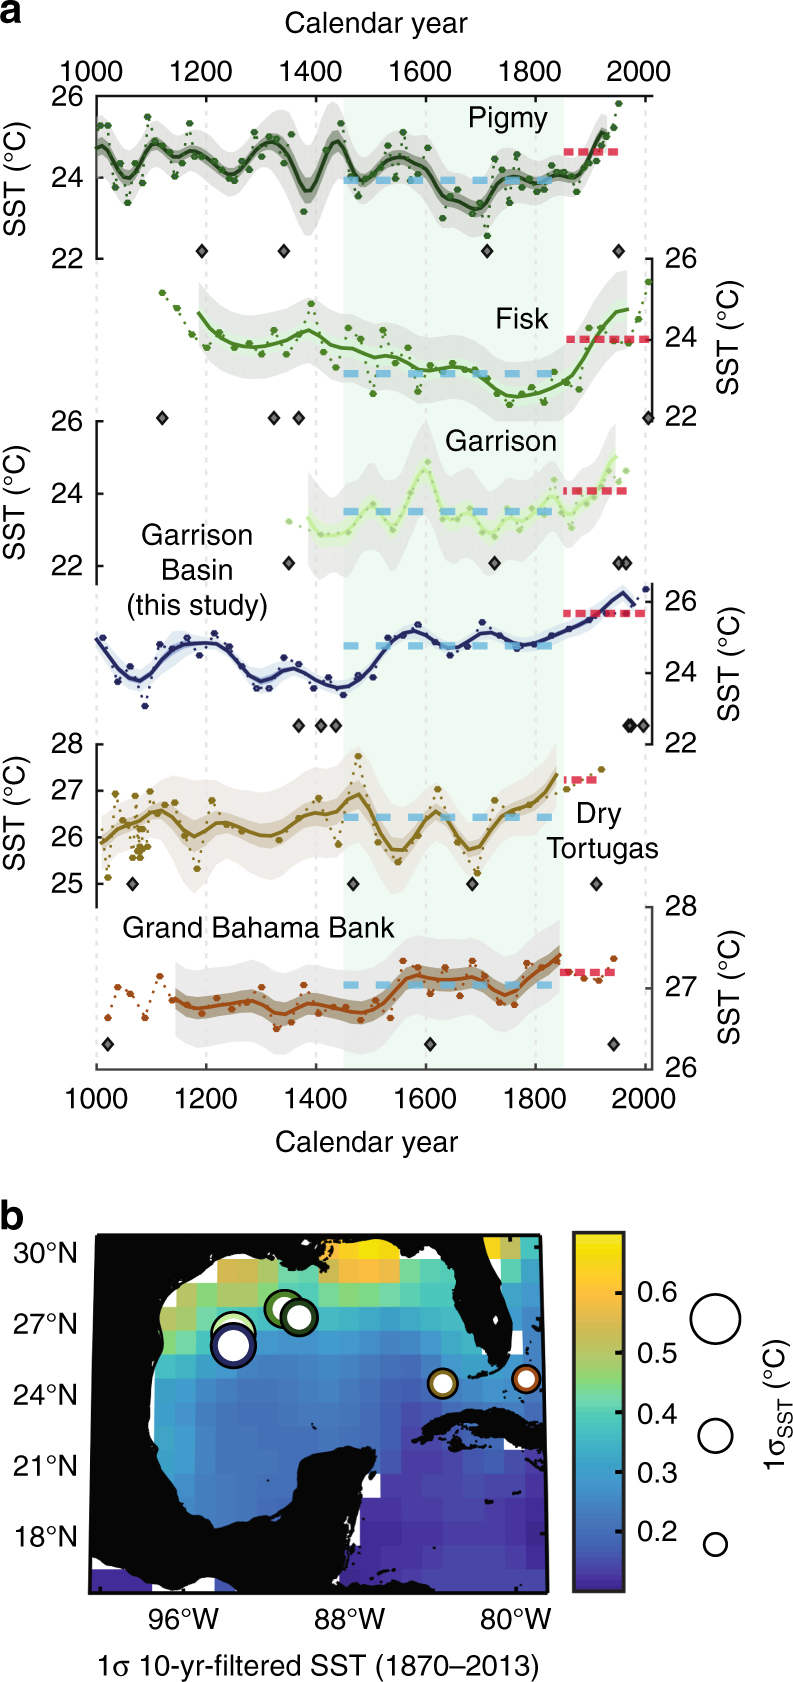
Fig. 3.

Regional comparison of SST records over the last millennium and proxy locations from the Gulf of Mexico. a Reconstructed SST data (circles connected by dotted lines) and 100-year filtered data (thick lines) with 68%, 95% confidence bounds plotted for each record. Previously published records are all reprocessed using the same calibration and uncertainty calculations as for the Garrison Basin records. Light green box highlights the Little Ice Age (1450–1850 C. E.) and blue and red dashed lines indicate the mean SST during the respective intervals. b Standard deviations of 10-year filtered SST from the monthly HadISST data set with proxy records overlain as white circles with border colors corresponding to above time series, scaled to indicate 1σ variability over the last millennium. Note that proxy SST variability is in line with expectations from instrumental SST variability (northern GOM 1σ-SST is larger than Florida Straits 1σ-SST)
