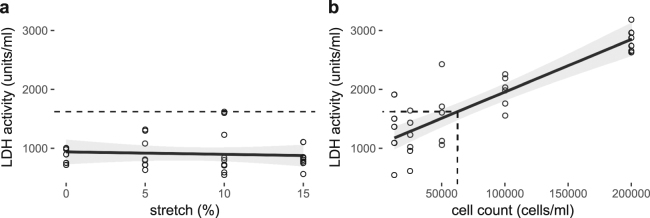
Figure 5.
LDH activity relative to the stretch magnitude and corresponding cell death. The dashed line indicates maximum LDH activity observed in experiment conditions (a) and the corresponding dead cell count (b), a maximum cell death of 8% of the initial cell seeding density in the stretching experiments with the average cell death being much less than that. n = 5–10, analyzed using One-way ANOVA with post-hoc Tukey-corrected multiple comparison tests. Solid line shows the linear regression for the data and the shaded region the 95% confidence interval of the regression (regression statistics in Table 1).

