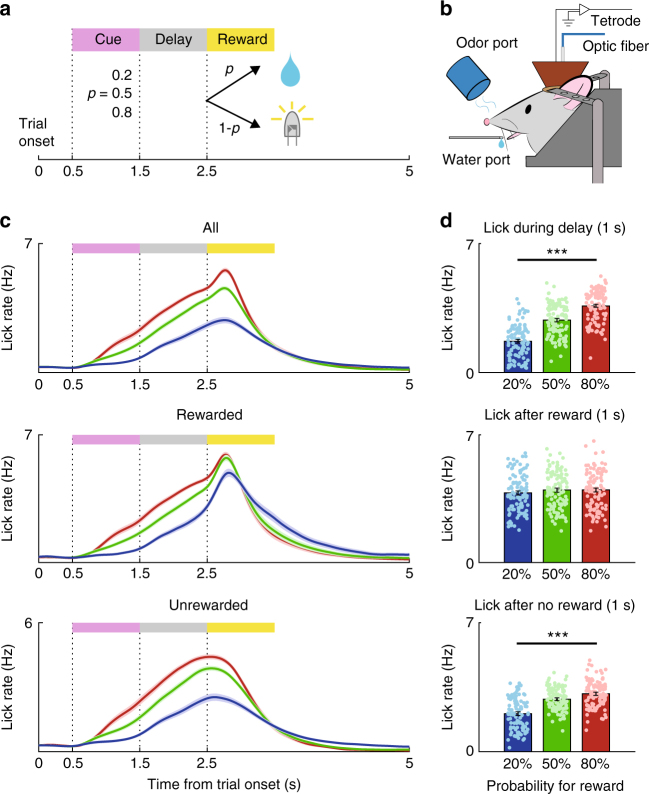
Fig. 1.
Behavioral task. a The structure of the probabilistic Pavlovian conditioning task. b Schematic of the experimental setting. c Licking behavior. Lick density functions (σ = 100 ms; mean±SEM across 107 sessions performed by five D1-Cre and four D2-Cre mice) are color-coded according to the odor cues that predict different reward probabilities for all trials (top), rewarded trials (middle), and unrewarded trials (bottom). d Mean (±SEM) lick rates during the delay period of all trials (top) and during the first 1 s after reward onset in rewarded (middle) and unrewarded (bottom) trials. Reward onset was defined as the time of the first lick after reward delivery in rewarded trials and as the time of LED light onset in unrewarded trials. Circles, individual session data. ***p < 0.001 (ANOVA followed by post-hoc Tukey’s test for all comparisons)

