Fig. 7.
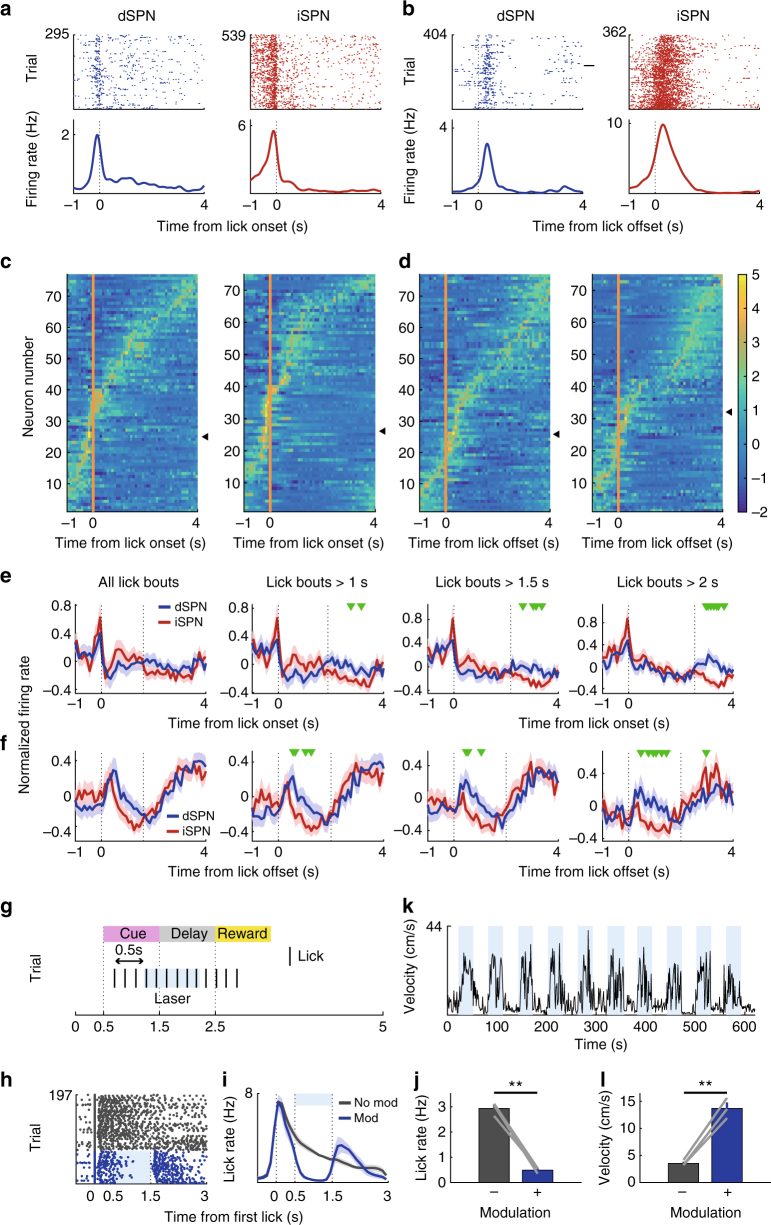
dSPN and iSPN responses to licking. a, b Examples of dSPNs and iSPNs responding to lick onset and offset. Time 0 denotes the time of the first (a) or last (b) lick in a lick bout. c, d Normalized responses (z-scores) of all dSPNs (n = 77) and iSPNs (n = 75) to lick onset and offset (100 ms bins). Triangles indicate example neurons from a and b. e, f Mean normalized responses of dSPNs and iSPNs to lick onset (e) and offset (f) are shown for all lick bouts and for lick bouts with >1, 1.5, or 2 s durations. The second vertical dashed line denotes the mean lick offset time (e) or mean next lick onset time (f). Green triangles denote significant differences between dSPNs and iSPNs (t-test, p < 0.05). g–l The effect of bilateral stimulation of D1 striatal neurons on licking and movement velocity. g Laser stimulation schematic for head-fixed mice. A continuous laser pulse (1-s duration) was given 0.5 s after the first lick post-cue onset in a randomly chosen subset (30%) of trials. h An example session showing the effect of laser stimulation on licking. Each row is one trial and each tick mark denotes a lick. Trials were grouped according to laser stimulation. i Group data (three D1-cre mice; each tested in two sessions). Lick density functions (σ = 10 ms) with and without the laser stimulus. j Mean lick rates with and without the laser stimulus (1-s period beginning 0.5 s after the first lick). k The same mice were also tested in a free-movement condition. Laser stimulation was applied continuously for 30 s with 30-s inter-trial intervals. A sample movement velocity trace during 10 laser-on–laser-off episodes (blue indicates laser-on). l Mean movement velocity under laser-on and laser-off conditions. **p < 0.01, paired t-test

