Fig. 8.
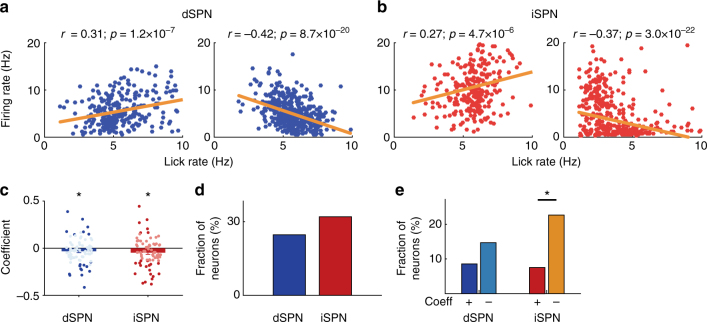
dSPN and iSPN responses to lick rate. a, b Examples of dSPNs (a) and iSPNs (b) whose firing rates show significant correlation with lick rate. Each dot represents mean lick rate and mean discharge rate during a lick bout. r, Pearson’s correlation coefficient. c Distributions of correlation coefficients between lick rate and firing rate (77 dSPNs and 75 iSPNs). Bold colors denote neurons whose activity shows significant correlation with lick rate. *significantly different from 0 (t-test, p < 0.05). d Fractions of dSPNs and iSPNs whose activity shows a significant correlation with lick rate. e Fractions of dSPNs and iSPNs whose activity shows a significant positive (+) or negative (−) correlation with lick rate. *p < 0.05 (χ2-test)

